Department of Internal Medicine, Ewha Womans University School of Medicine, Seoul, Korea.
1Department of Urology, Ewha Womans University School of Medicine, Seoul, Korea.
Copyright © 2015, The Ewha Medical Journal
This is an Open Access article distributed under the terms of the Creative Commons Attribution Non-Commercial License (http://creativecommons.org/licenses/by-nc/3.0/) which permits unrestricted non-commercial use, distribution, and reproduction in any medium, provided the original work is properly cited.
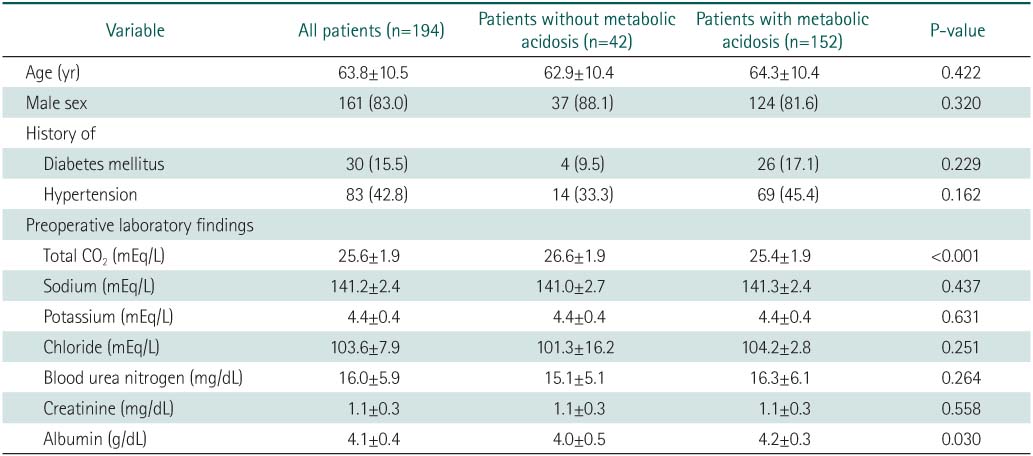
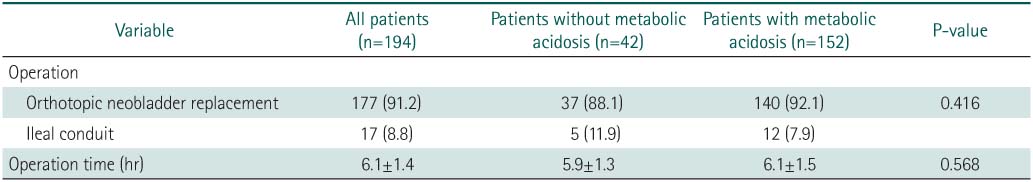
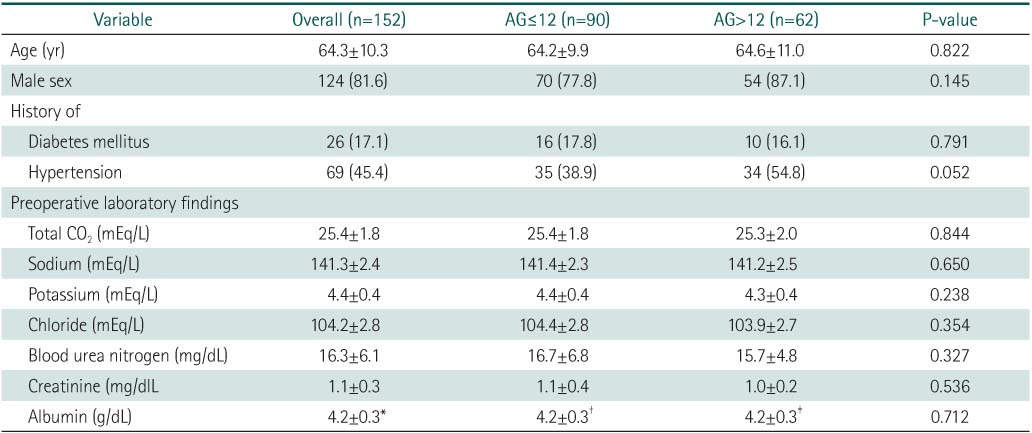
Values are presented as mean±standard deviation or number (%).
AG, anion gap.
Number of included patients was *107, †68, and ‡39.
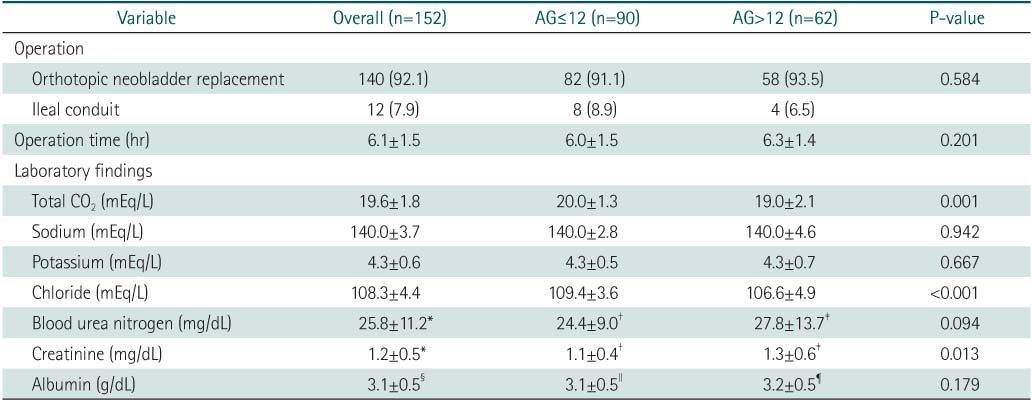
Values are presented as mean±standard deviation or number (%).
AG, anion gap.
Number of included patients was *149, †89, ‡60, §81, ∥48, and ¶31.
Values are presented as mean±standard deviation or number (%). ANOVA and Bonferroni tests were applied for comparisons.
POD, postoperative day.
*P=0.043 vs. POD>14. †P=0.046 vs.1<POD≤14. ‡P=0.041 vs. 1<POD≤14.
Values are presented as mean±standard deviation or number (%). ANOVA and Bonferroni tests were applied for comparisons.
POD, post operative day.
*P=0.010 vs. POD>14. †P=0.046 vs. POD>14. ‡P=0.002 vs. POD>14. §P=0.008 vs. POD>14. ∥P=0.002 vs. POD≤14. ¶Number of included patients were 47, 20 and 12 in group with POD1, group of 1<POD≤14, and group of POD>14 respectively. **P<0.001 vs. POD>14. ††P=0.012 vs. POD>14.

Values are presented as mean±standard deviation or number (%).
Values are presented as mean±standard deviation or number (%).
Values are presented as mean±standard deviation or number (%).
AG, anion gap.
Number of included patients was *107, †68, and ‡39.
Values are presented as mean±standard deviation or number (%).
AG, anion gap.
Number of included patients was *149, †89, ‡60, §81, ∥48, and ¶31.
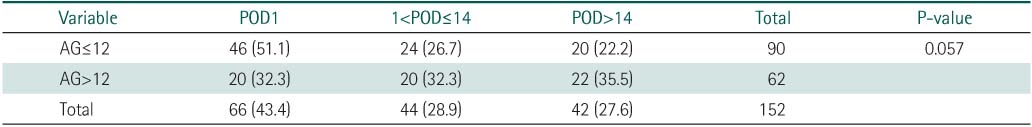
Values are presented as number (%).
AG, anion gap; POD, postoperative day.
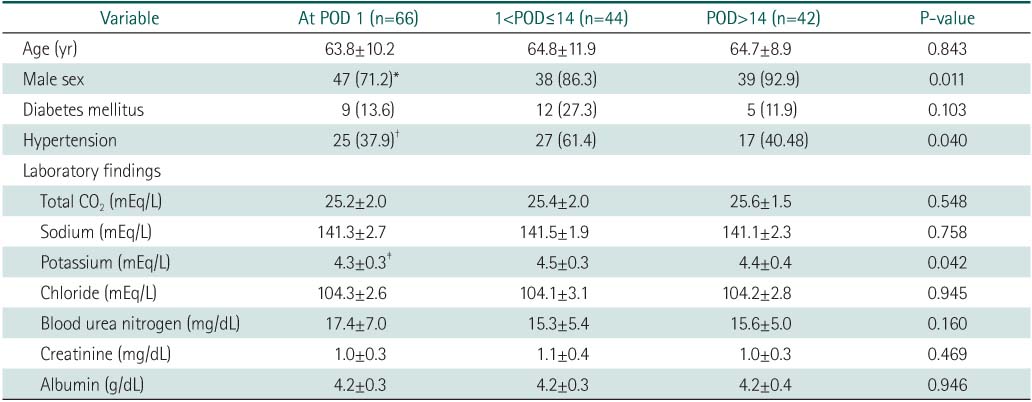
Values are presented as mean±standard deviation or number (%). ANOVA and Bonferroni tests were applied for comparisons.
POD, postoperative day.
*P=0.043 vs. POD>14. †P=0.046 vs.1<POD≤14. ‡P=0.041 vs. 1<POD≤14.
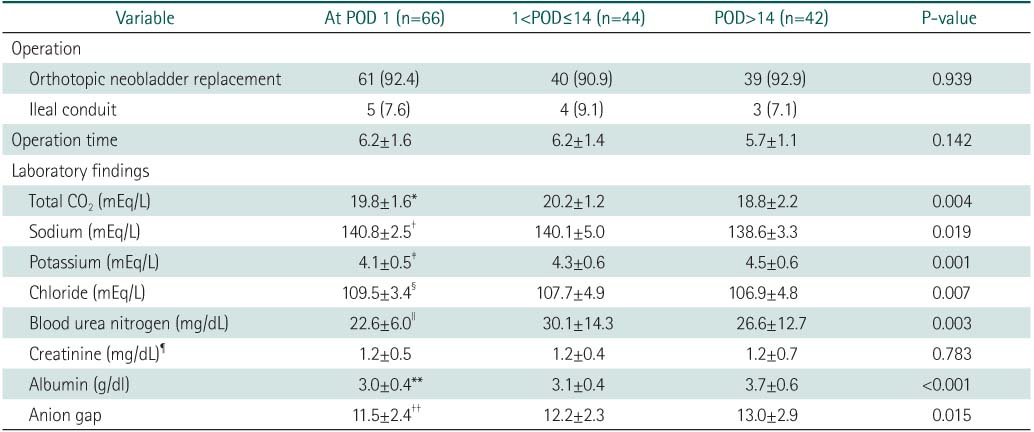
Values are presented as mean±standard deviation or number (%). ANOVA and Bonferroni tests were applied for comparisons.
POD, post operative day.
*P=0.010 vs. POD>14. †P=0.046 vs. POD>14. ‡P=0.002 vs. POD>14. §P=0.008 vs. POD>14. ∥P=0.002 vs. POD≤14. ¶Number of included patients were 47, 20 and 12 in group with POD1, group of 1<POD≤14, and group of POD>14 respectively. **P<0.001 vs. POD>14. ††P=0.012 vs. POD>14.
Values are presented as mean±standard deviation or number (%).
Values are presented as mean±standard deviation or number (%).
Values are presented as mean±standard deviation or number (%). AG, anion gap. Number of included patients was *107, †68, and ‡39.
Values are presented as mean±standard deviation or number (%). AG, anion gap. Number of included patients was *149, †89, ‡60, §81, ∥48, and ¶31.
Values are presented as number (%). AG, anion gap; POD, postoperative day.
Values are presented as mean±standard deviation or number (%). ANOVA and Bonferroni tests were applied for comparisons. POD, postoperative day. *P=0.043 vs. POD>14. †P=0.046 vs.1<POD≤14. ‡P=0.041 vs. 1<POD≤14.
Values are presented as mean±standard deviation or number (%). ANOVA and Bonferroni tests were applied for comparisons. POD, post operative day. *P=0.010 vs. POD>14. †P=0.046 vs. POD>14. ‡P=0.002 vs. POD>14. §P=0.008 vs. POD>14. ∥P=0.002 vs. POD≤14. ¶Number of included patients were 47, 20 and 12 in group with POD1, group of 1<POD≤14, and group of POD>14 respectively. **P<0.001 vs. POD>14. ††P=0.012 vs. POD>14.