Abstract
-
Objectives:
This study investigated the 24-hour ambulatory blood pressure monitoring (ABPM) and Holter parameters for evaluating their prognostic significance of cardiovascular events including stroke in population without atrial fibrillation (AF).
-
Methods:
Among 3,199 patients that underwent ABPM, 335 who also underwent Holter recordings were selected in a tertiary hospital. Seventeen patients who had been documented with AF on Holter monitoring or diagnosed with AF were excluded, and finally 318 patients were analyzed. The association between cardiovascular events and ABPM/Holter parameters was analyzed by a logistic regression model, and the risk factors were estimated by a Cox hazard model. Age, sex, and histories of cardiovascular disease were adjusted by a multivariable analysis, and the cut-off values were suggested by a Kaplan-Meyer analysis.
-
Results:
During the total follow-up (28.5±1.7 months), 13 (4.1%) stroke, 6 (1.9%) heart failure, and 12 (3.8%) acute coronary syndrome incidences were observed. In the univariate analysis of the ABPM parameters, an increment in the night systolic BP (hazard ratio=1.034, P=0.020) and night diastolic BP (hazard ratio=1.063, P=0.031) significantly elevated the risk of a stroke occurrence. According to the Kaplan-Meyer analysis, there was a significant difference in the stroke incidence between the groups divided by a cut-off value of the night systolic BP of 120 mmHg (P=0.014) and night diastolic BP of 75 mmHg (P=0.023).
-
Conclusion:
In a population without AF, the nocturnal BP was a significant predictor of a stroke incidence. At this point, the cut-off value of mean 120/75 mmHg in 24 ABPM was advisable.
-
Keywords: Blood pressure monitoring; ambulatory; Holter; Cardiovascular diseases; Stroke
Introduction
Blood pressure (BP) monitoring and the electrocardiogram (ECG) are fundamental tools for assessing the risk of cardiovascular disease (CVD). Among them, 24-hour ambulatory BP monitoring (ABPM) and Holter monitoring are the most accurate diagnostic tools for measuring BP fluctuations and rhythm changes during the day [
1-
4]. The 24-hour ABPM is useful for predicting the risk of CVD by measuring the change in the continuous BP and the BP during sleep, and the Holter gives a lot of information on the ECG to diagnose arrhythmias [
5]. In addition, the Holter contains information on the heart rate variability, which represents the activity of the sympathetic / parasympathetic nervous system, which is known to be highly related to the development of CVD [
6]. Nevertheless, measuring the patient's BP and ECG for 24-hour has the disadvantage of having to be attached to the body for a long time, so it is not easy to use them in the clinic. However, with the recent popularization of wearable devices, it is possible to measure the BP, heart rate, and ECG over 24-hour as well as during sleep [
7]. Continuous ECG monitoring is useful in detecting arrhythmias including atrial fibrillation (AF) [
8]. Continuous BP monitoring also has many clinical implications in chronic kidney disease. Compared to an office BP, the ABPM is recommended as a better tool in assessing a renal prognosis [
9,
10] and the cardiovascular risk of non-dialysis chronic kidney disease patients [
11].
However, the ECG measured by a wearable device is just a single lead ECG, and the BP recorded through the wearable device is not accurate and is in an experimental stage as compared to the conventional BP monitoring [
12]. Therefore, it seems to be of great significance to find the clinical implication of the continuous medical data measured by 24-hour ABMP and Holter monitoring in the development of CVD. So, we wanted to determine the relationship between heart failure (HF), acute coronary syndrome (ACS), AF, and the stroke incidence, which have been known as typical CVDs, and the parameters of 24-hour ABPM and Holter monitoring. Further, since AF is already known as the strongest risk factor for a stroke [
13], we tried to find the risk factors for CVDs including strokes in patients without AF from 24-hour ABPM and Holter monitoring.
Methods
1. Study design
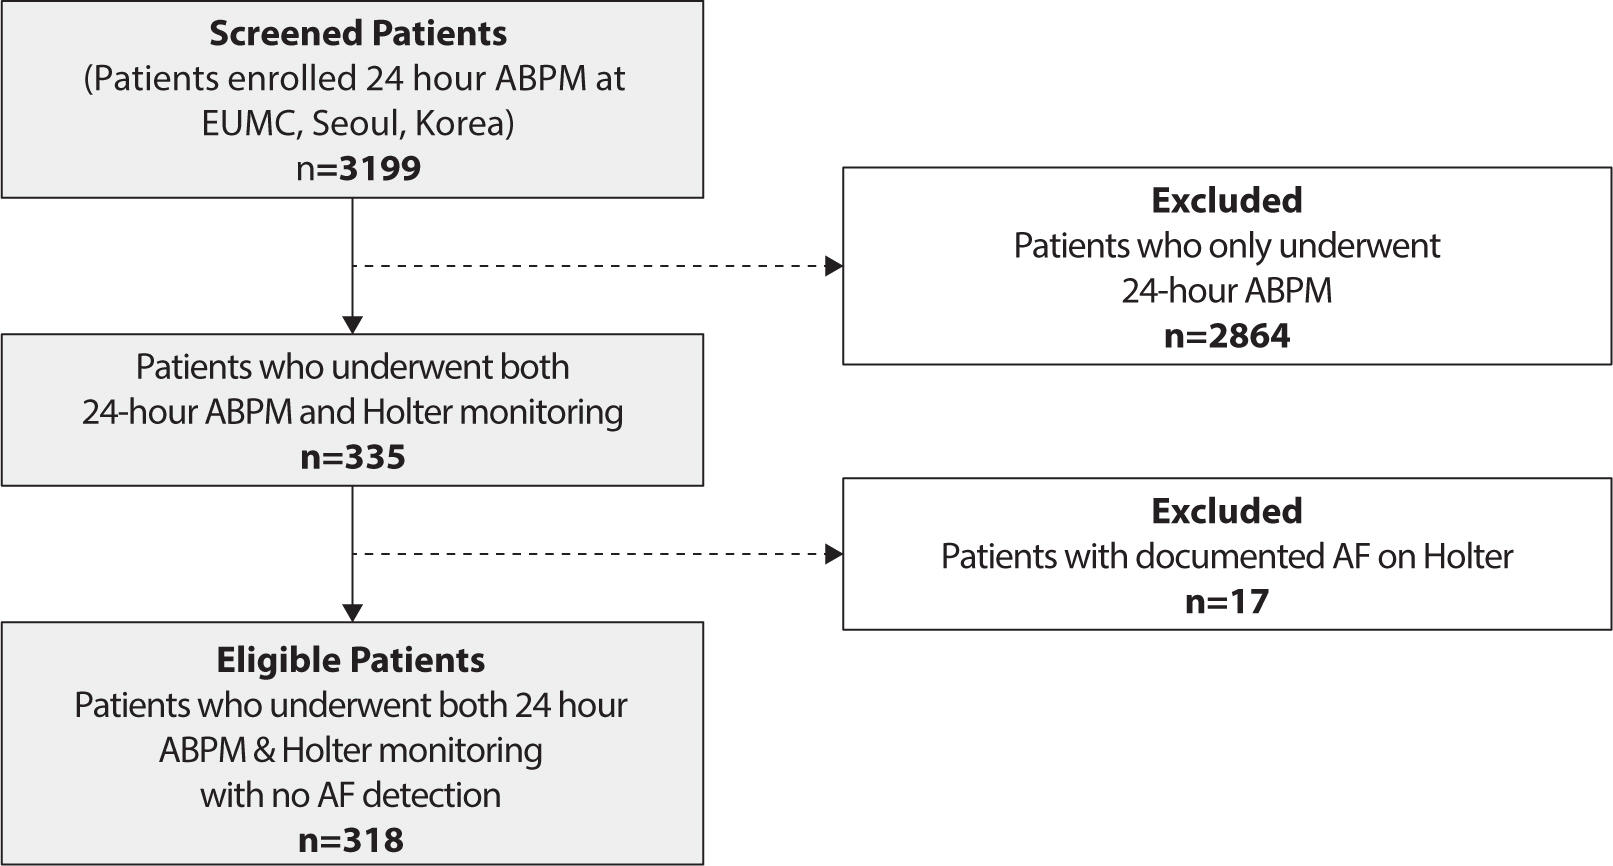
This study protocol was approved by the institutional review board of the Ewha Womans University Mokdong Hospital (IRB number: 2019-12-025-002). The study participants were selected from 3,199 patients who underwent ABPM at a tertiary general hospital (Ewha Womans University Medical Center, Seoul, Korea) from January 15, 2010 to November 27, 2018. The medical record dataset included information on the diagnosis based on the tenth revision of the International Classification of Disease (ICD-10) codes, admission, and treatment. A past history including congestive HF, hypertension, diabetes mellitus (DM), strokes, and ACS were analyzed by the existence of main diagnosis data with an ICD code (I50, I10-I15, E10-E14, I63-I66, I20-I25 respectively). For the analysis, patients who had been diagnosed with AF were excluded. Further, the study was conducted based on electronic medical records of 335 patients who also received Holter monitoring. Among them, 17 patients with documented AF on the Holter were excluded. At last, a final analysis was obtained in 318 eligible participants (
Fig. 1). Finally the patients analyzed were followed up for 748.5 person-years in total. The average follow-up period was 28.6 months.
Fig. 1.Study design. By screening 3,199 patients who received 24 hr ABPM, 335 patients who also participated in Holter monitoring were enrolled. After excluding 17 patients with documented AF, 318 patients were eligible for the study analysis. ABPM, ambulatory blood pressure monitoring; AF, atrial fibrillation.
2. Study variables
The data of the independent variables were obtained from the ABPM and Holter monitoring. According to the ABPM results, a non-dipper was defined. A non-dipper was a subject whose mean BP did not decrease greater than 10% during sleep as compared to that during the daytime. Otherwise, the subject was defined as a dipper [
14]. Covariates were collected based on the subject’s first interview, physical examination, and laboratory data executed for their cardiovascular examinations. Those covariates were the height, weight, body mass index, tobacco usage, and past histories of hypertension, type 2 DM, dyslipidemia, and AF. The lipid profiles of low density lipoprotein cholesterol and total cholesterol were gathered. The history of CVD such as a stroke, HF, or ACS was also collected.
The endpoint of this study was the occurrence of a stroke, HF, or ACS. All events were prespecified and coded according to the International Classification of Diseases 10th Revision (ICD-10). The total cardiovascular events in this study referred to the occurrence of either a stroke, HF, or ACS events.
3. Measurement (24-hour ambulatory blood pressure monitoring [ABPM], 24-hour Holter)
Both tests were performed on an inpatient or outpatient basis as the workups of the patients’ clinical problems. BP measurements and ECG monitoring were recorded for 24-hour. A TM – 2430 (A&D, Tokyo, Japan) device was used for the ABPM. A SEER light (GE, Tokyo, Japan) device was used for the Holter monitoring. The data obtained did not include any unnecessary personal information to ensure the anonymity of the individuals. Also, the patient’s information for the analysis was encrypted.
4. Statistical analysis
For the database management and statistical analysis, this study used IBM SPSS Statistics 25.0 software. A Student’s t-test was used to compare the quantitative variables of the baseline characteristics. A Pearsons’ chi-square test (χ2 test) was used to analyze the qualitative variables. Moreover, the logistic regression model was used to find the significant parameters from the Holter and ABPM monitoring. In this analysis, the sex, age and other significant covariates were adjusted by the multiple regression model. Hazard ratios (HR) and CI were calculated by a Cox analysis. Finally, the survival curves of the significant ABPM parameters were estimated using a Kaplan Meier survival analysis.
Results
The baseline characteristics were analyzed in 335 individuals. The study population was composed of 52.8% (n=177) males and 47.2% (n=158) females. The average age of the population was 56.4±0.89 years. The mean body mass index was 24.5±3.48 kg/m
2, 13.4% (n=45) were current smokers, 25.0% (n=84) had a history of CVD, 54.0% (n=181) were diagnosed with hypertension, 5.0% (n=17) had known AF, 12.2% (n=41) had type 2 DM, and 13.1% (n=44) had dyslipidemia. The mean LDL cholesterol level was 97.43±41.86 mg/dL. The mean total cholesterol level was 168.79±49.21 mg/dL. The 24-hour mean BP of the study population was 129/79 mmHg (±16/10). The mean BP during the daytime and nighttime were 133/82 mmHg (±16/10) and 121/72 mmHg (±17/12), respectively (
Table 1).
Table 1. General characteristics of the study population analyzed by the cardiovascular disease morbidity
|
Characteristics |
Non-CVD (n=308) |
CVD (n=27) |
P-value |
|
Clinical features |
Female [n (%)] |
146 (47.4) |
12 (44.4) |
0.925 |
|
Age (yrs±SD) |
55.85±16.52 |
63.19±13.73 |
0.026*
|
|
BMI (kg/m2±SD) |
24.56±3.51 |
24.25±3.08 |
0.664 |
|
Questionnaires |
Tobacco use [n (%)] |
40 (13.1) |
5 (18.5) |
0.388 |
|
DM [n (%)] |
36 (11.8) |
5 (18.5) |
0.354 |
|
CVD Hx [n (%)] |
64 (20.8) |
20 (74.1) |
<0.001***
|
|
Known AF [n (%)] |
12 (3.8) |
5 (18.5) |
<0.001***
|
|
HTN Hx [n (%)] |
163 (52.9) |
18 (66.7) |
0.227 |
|
Dyslipidemia Hx [n (%)] |
37 (12.0) |
7 (25.9) |
0.067 |
|
Biochemical data |
LDL (mg/dL) |
98.18±41.60 |
89.10±36.45 |
0.334 |
|
Total cholesterol (mg/dL) |
169.81±49.30 |
158.56±48.10 |
0.276 |
1. Comparison of the patients with and without cardiovascular events
Table 1 shows the clinical differences between the patients with or without primary events. During the follow up, 27 (8.4%) patients experienced 13 (4.0%) strokes, 12 (3.7%) ACSs, and 6 (1.8%) HF events. In comparison to those who remained free of disease, the patients who experienced CVD were older (P=0.026), and had a more frequent history of CVD (P<0.001) and AF (P<0.001;
Table 1). The Supplemental Tables (Tables S1–S3) show the baseline characteristic analysis based on each disease. The stroke patients were older (P=0.028) and more often had AF (P=0.002) and dyslipidemia (P=0.018). They also had more histories of CVDs (P<0.001). Similarly, the ACS and HF patients had significantly more CVD histories than those without them (P=0.002, 0.004, respectively). The HF patients additionally had a more frequent history of AF (P=0.001; Tables S1–S3).
2. Analysis of the 24-hour ambulatory blood pressure monitoring (ABPM) and Holter variables
This study examined the association between each CVD (strokes, ACS, and HF) and the parameters of the ABPM/Holter.
Tables 2-
3 shows the results of the logistic regression analysis for the stroke incidence. In
Table 2, the mean 24-hour systolic BP (sBP, odds ratios [OR]=1.040, 95% CI 1.006–1.075, P=0.020), daytime mean sBP (OR=1.038, 95% CI 1.003–1.074, P=0.032), night time sBP (OR=1.037, 95% CI 1.006–1.068, P=0.017), and night time diastolic BP (dBP, OR=1.062, 95% CI=1.003–1.124, P=0.040) had significant associations with the stroke incidence. After an adjustment for the sex, age, and a history of CVD, only the night mean dBP had a significant association (OR=1.118, 95% CI 1.016–1.231, P=0.022).
Table 2.OR and 95% CIs of the stroke incidence according to the parameters of the 24-hour ABPM in people without atrial fibrillation
|
Variable of 24 hr ABPM |
Unadjusted |
Adjusted†
|
|
OR (95% CI) |
P-value |
OR (95% CI) |
P-value |
|
24 hr BP |
Mean sBP (mmHg) |
1.040 (1.006–1.075) |
0.020*
|
1.040 (0.995–1.086) |
0.080 |
|
Mean dBP (mmHg) |
1.031 (0.971–1.095) |
0.319 |
1.080 (0.991–1.177) |
0.080 |
|
Day BP |
Mean sBP (mmHg) |
1.038 (1.003–1.074) |
0.032*
|
1.037 (0.993–1.083) |
0.096 |
|
Mean dBP (mmHg) |
1.014 (0.952–1.080) |
0.665 |
1.052 (0.971–1.140) |
0.213 |
|
Systolic load (%) |
1.011 (0.990–1.032) |
0.305 |
1.011 (0.986–1.036) |
0.399 |
|
Diastolic load (%) |
0.999 (0.974–1.024) |
0.931 |
1.009 (0.978–1.041) |
0.558 |
|
Night BP |
Mean sBP (mmHg) |
1.037 (1.006–1.068) |
0.017*
|
1.035 (0.994–1.078) |
0.099 |
|
Mean dBP (mmHg) |
1.062 (1.003–1.124) |
0.040*
|
1.118 (1.016–1.231) |
0.022*
|
|
Systolic load (%) |
1.003 (0.998–1.008) |
0.210 |
1.002 (0.997–1.007) |
0.447 |
|
Diastolic load (%) |
1.026 (1.000–1.053) |
0.053 |
1.032 (0.997–1.068) |
0.072 |
|
Dipper |
0.237 (0.048–1.159) |
0.075 |
0.244 (0.037–1.608) |
0.143 |
Table 3.OR and 95% CIs of the stroke incidence according to the parameters of the 24-hour Holter examination in people without atrial fibrillation
|
Variable of 24 hr Holter |
Unadjusted |
Adjusted†
|
|
OR (95% CI) |
P-value |
OR (95% CI) |
P-value |
|
Arrhythmia |
APC (%) |
0.000 |
0.996 |
0.000 |
0.996 |
|
PVC (%) |
0.000 |
0.995 |
0.000 |
0.995 |
|
Time domain |
Average HR (beat/m) |
1.013 (0.954–1.076) |
0.666 |
1.027 (0.959–1.099) |
0.449 |
|
Mean NN (ms) |
1.000 (0.995–1.005) |
0.906 |
0.998 (0.992–1.004) |
0.502 |
|
SDNN (ms) |
0.979 (0.960–0.998) |
0.030*
|
0.983 (0.957–1.008) |
0.181 |
|
SDaNN (ms) |
0.974 (0.952–0.996) |
0.020*
|
0.928 (0.955–1.010) |
0.200 |
|
Heart rate variability |
LF (ms) |
1.004 (0.997–1.011) |
0.257 |
1.004 (0.993–1.015) |
0.460 |
|
HF (ms) |
0.874 (0.728–1.049) |
0.149 |
0.888 (0.711–1.111) |
0.299 |
|
L/H (ms) |
1.046 (0.210–5.198) |
0.956 |
2.102 (0.410–10.781) |
0.373 |
Table 3 shows the correlation between the stroke incidence and Holter parameters. The significant parameters were the SD of all NN intervals (SDNN; P=0.030) and SD of the averages of the NN intervals (SDaNN; P=0.020). However, after the adjustment, they were not significant (
Tables 2-
3). The correlation between the ambulatory tests and ACS, HF, and total CVD events is presented in Tables S4–S9. In the single-variable analysis of the Holter parameters for the ACS incidence, the OR for atrial premature complexes (%) was 1.226 (CI: 1.017–1.478, P=0.032, Table S5) and the OR for PVCs (%) was 1.150 (CI: 1.007–1.314, P=0.040, Table S5). Further, in the 24-hour ABPM, the ORs for the mean 24-hour sBP (OR=1.053, CI: 1.005–1.104, P=0.031) and daytime mean sBP (OR=1.054, CI: 1.004–1.106, P=0.034) for HF (Table S6) were statistically significant (Tables S4–S9).
3. 24-hour ambulatory blood pressure monitoring (ABPM) as a predictor of the morbidity risk
Table 4 shows the Cox regression results of the ABPM parameters for strokes, ACS, and HF. In the case of a stroke, the risk increased significantly as the night mean sBP (HR=1.034, P=0.020) and night mean dBP (HR=1.063, P=0.031) increased. After the adjustment, only the nighttime mean dBP (HR=1.060, P=0.045) was statistically significant for predicting the risk of stroke morbidity. There was no significant variable related to the development of the total CVD for the ABPM. As for the HF, in the multivariate analysis, a higher daytime mean sBP (HR=1.089, P=0.050) increased the HF risk (
Table 4).
Table 4.HR and 95% CIs of the incidence of cardiovascular disease according to the 24-hour ABPM parameters analyzed by a Cox proportional hazard model
|
Variable of 24 hr ABPM |
Unadjusted |
Adjusted |
|
HR (95% CI) |
P-value |
HR (95% CI) |
P-value |
|
Stroke |
24 Mean sBP |
1.038 (1.005–1.71) |
0.021*
|
1.031 (0.998–1.066) |
0.064 |
|
24 Mean dBP |
1.033 (0.976–1.093) |
0.263 |
1.053 (0.992–1.118) |
0.091 |
|
Day mean sBP |
1.036 (1.002–1.070) |
0.035*
|
1.033 (0.999–1.069) |
0.057 |
|
Day mean dBP |
1.019 (0.961–1.080) |
0.531 |
1.042 (0.980–1.109) |
0.191 |
|
Night mean sBP |
1.034 (1.005–1.064) |
0.020*
|
1.025 (0.996–1.056) |
0.097 |
|
Night mean dBP |
1.063 (1.006–1.123) |
0.031*
|
1.060 (1.001–1.121) |
0.045*
|
|
Dipper |
0.261 (0.054–1.258) |
0.094 |
0.361 (0.071–1.837) |
0.220 |
|
ACS |
24 Mean sBP |
0.980 (0.938–1.025) |
0.379 |
0.982 (0.943–1.023) |
0.388 |
|
24 Mean dBP |
0.967 (0.911–1.026) |
0.270 |
0.970 (0.916–1.027) |
0.296 |
|
Day mean sBP |
0.795 (0.932–1.020) |
0.277 |
0.976 (0.935–1.020) |
0.279 |
|
Day mean dBP |
0.952 (0.883–1.027) |
0.204 |
0.951 (0.882–1.027) |
0.202 |
|
Night mean sBP |
0.991 (0.952–1.031) |
0.642 |
0.987 (0.949–1.026) |
0.509 |
|
Night mean dBP |
0.994 (0.939–1.052) |
0.830 |
0.986 (0.937–1.038) |
0.587 |
|
Dipper |
2.282 (0.57–9.129) |
0.243 |
1.911 (0.453–8.055) |
0.378 |
|
HF |
24 Mean sBP |
1.053 (1.002–1.106) |
0.040*
|
1.052 (0.994–1.114) |
0.078 |
|
24 Mean dBP |
1.069 (0.984–1.161) |
0.114 |
1.090 (0.987–1.203) |
0.088 |
|
Day mean sBP |
1.054 (1.005–1.106) |
0.032*
|
1.089 (1.000–1.990) |
0.050*
|
|
Day mean dBP |
1.060 (0.978–1.148) |
0.157 |
1.083 (0.908–1.195) |
0.116 |
|
Night mean sBP |
1.044 (0.997–1.093) |
0.065 |
1.046 (0.994–1.101) |
0.083 |
|
Night mean dBP |
1.094 (0.997–1.201) |
0.057 |
1.085 (0.972–1.210) |
0.146 |
|
Dipper |
0.830 (0.116–5.923) |
0.853 |
2.726 (0.198–37.589) |
0.454 |
Being a dipper had a preventive effect on the incidence of the total cardiovascular events (HR=0.379, P=0.047; Table S10). The risk analysis of the Holter parameters are presented in Table S11. In the case of a stroke, the risk decreased as the SDNN (HR=0.973, P=0.009) and SDaNN (HR=0.966, P=0.008) increased in the Holter monitoring (Table S11). The risk of ACS increased significantly when the percent (%) of atrial premature complexes (HR=1.207, P=0.036) increased on the Holter (Table S11).
4. Night blood pressure (BP) cut-off value for a stroke prognosis prediction
According to the results of the Cox analysis, this study determined the cut-off value of the night mean BP, since it turned out to have a prognostic significance for strokes. In
Fig. 2A, when the cut-off value of the night sBP was set to 120 mmHg (P=0.014), the stroke incidence was significantly predicted. In
Fig. 2B, a night dBP of 75 mmHg (P=0.023) was a significant cut-off value. Taken together in
Fig. 2C, when the two groups were divided based on a night BP of 120/75 mmHg (P=0.006), there was a significant difference in the stroke risk over time (
Fig. 2A-C).
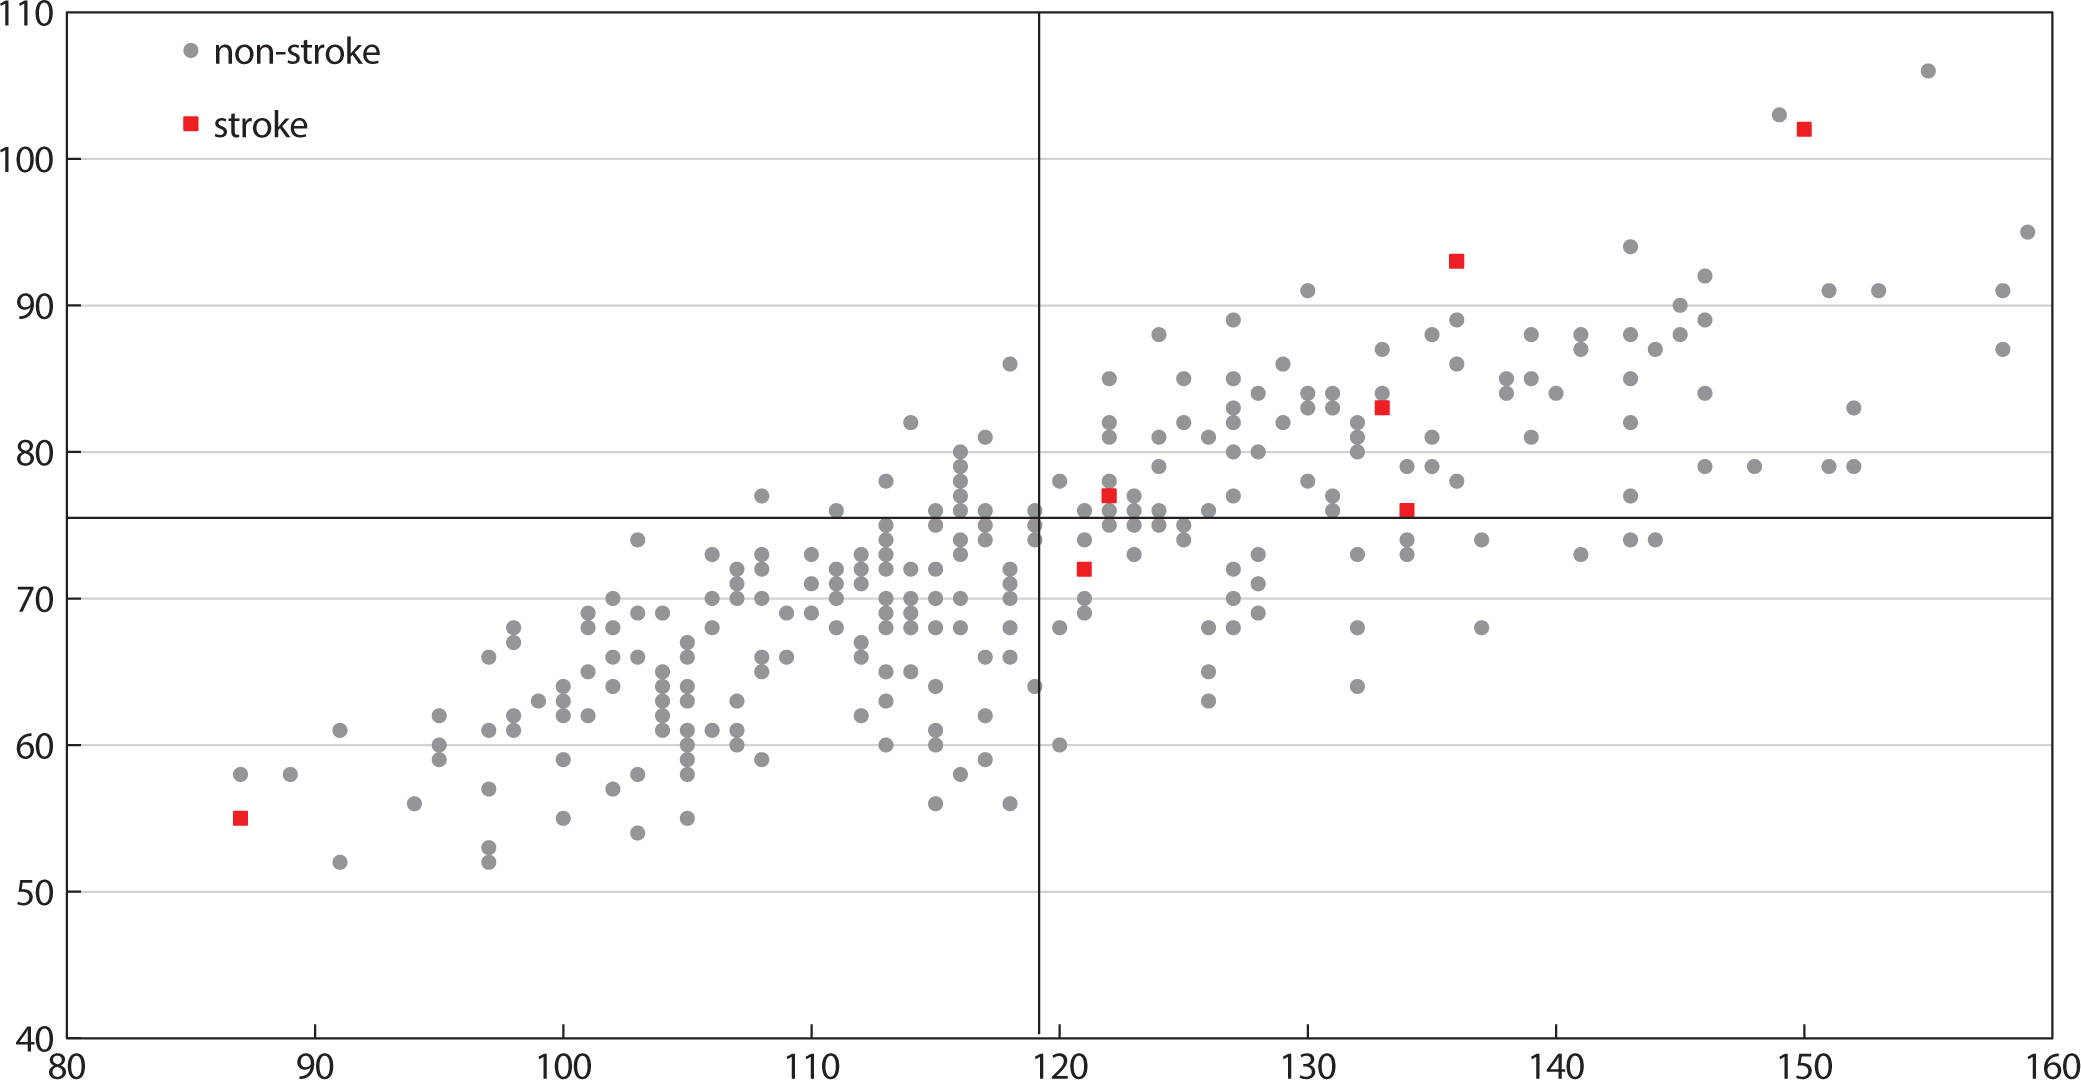
Fig. 3 shows the relationship between the stroke distribution according to the night BP and a cut-off value of 120/75 mmHg based on
Fig. 2.
Fig. 2.Fraction survival free from strokes according to the cutoff value of the nighttime BP. (A) By a Kaplan-Meyer analysis, the significant difference in the stroke incidence between the groups divided by the cut-off value was a nighttime sBP of 120 mmHg. (B) In the case of the nighttime dBP, 75 mmHg was a significant cut-off value. (C) Also both the nighttime BP cut-off values of 120/75 mmHg were significant. SBP, systolic blood pressure; DBP, diastolic blood pressure; BP, blood pressure.
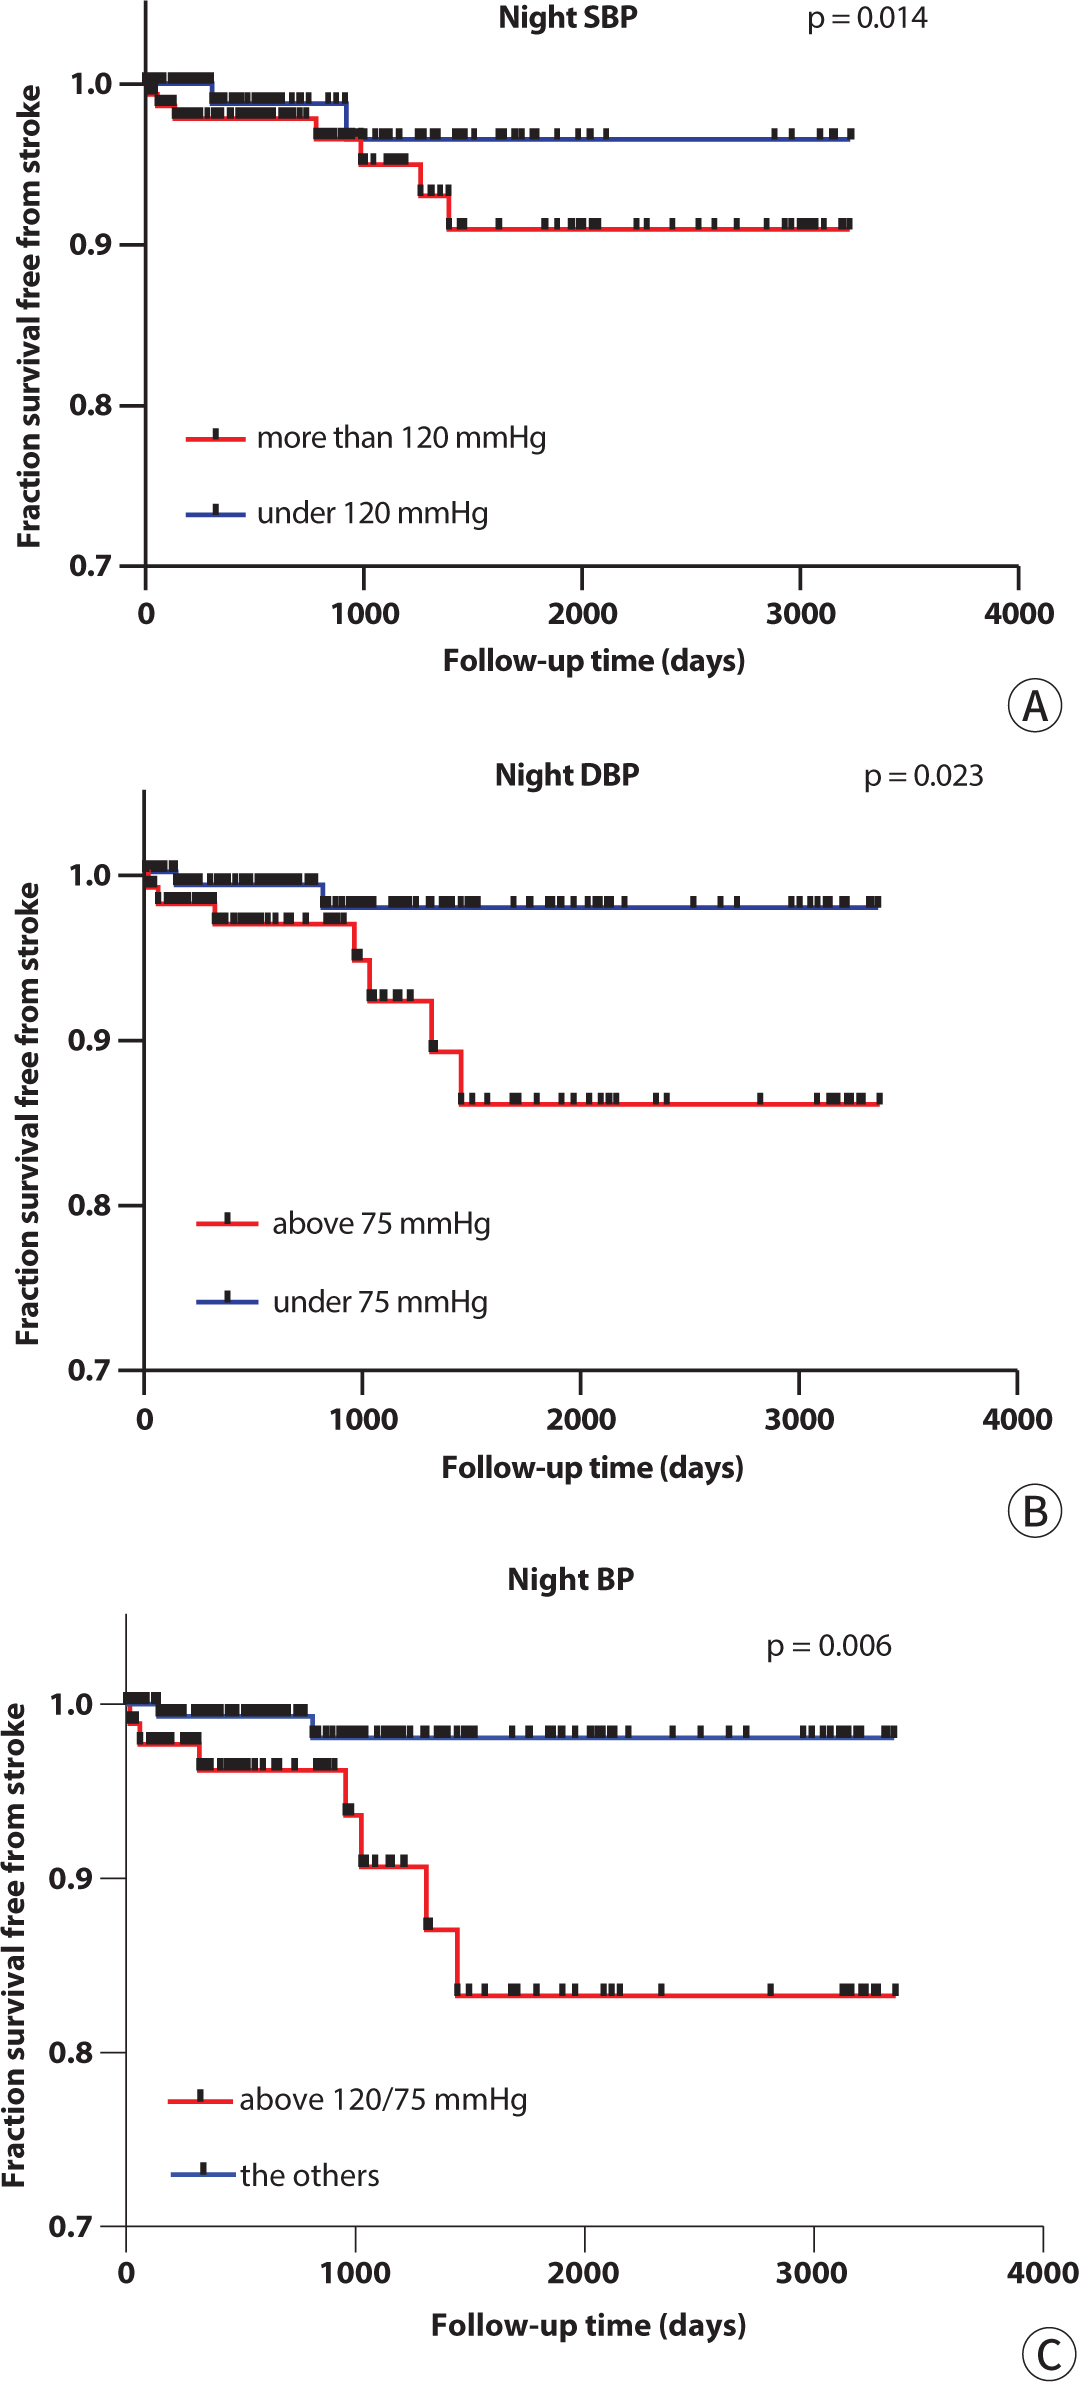
Fig. 3.Stroke incidence according to the nighttime BP cut-off value. The data of the 318 patients are distributed based on the nighttime sBP/dBP (mmHg). Nine patients with an occurrence of a stroke are marked as red boxes, and the grey circles mean the patients without a stroke. The cut-off of 120/75 mmHg was suggested by the Kaplan Meier survival analysis (P=0.006). BP, blood pressure; sBP, systolic blood pressure; dBP, diastolic blood pressure.

Discussion
In this study, we analyzed the prognostic parameters of CVD events using data obtained from Holter and 24-hour ABPM monitoring in 335 patients. Through this analysis, we observed that in a population without AF, nocturnal BP emerged as a significant predictor of stroke incidence. Notably, we found that a mean nocturnal BP of 120/75 mmHg on 24-hour ABPM could serve as an advisable cut-off value.
1. Prognostic ability of the 24-hour ambulatory blood pressure monitoring (ABPM)
Previous studies on the relationship between 24-hour ABPM and CVD outcomes have been limited. The first study, conducted by Perloff and colleagues [
15], involved 751 patients and assessed both daytime ABP and clinical blood BP measurements over a 5-year follow-up period. Their findings demonstrated that a combination of 24-hour ABPM and clinical BP values was a more accurate predictor of cardiovascular events compared to clinical BP alone. While this study faced some criticism, it pioneered the exploration of 24-hour ABPM's prognostic value. The second study, published by Verdecchia and colleagues [
16], followed 1,187 hypertensive individuals and 205 normotensive men and women for an average duration of 3.2 years. The observed event rate was similar among normotensive individuals and those with white-coat hypertension, but significantly higher among individuals with sustained hypertension. The current study contributes additional insights into the prognostic value of 24-hour ABPM, specifically in patients with higher nocturnal BP, a high-risk group for cardiovascular complications.
In the case of a stroke, the nighttime BP was more related to the events than the daytime BP. When predicting the risk (HR), both a higher night sBP and the dBP, significantly increased the risk of a stroke occurrence in the univariate Cox regression analysis. The Night dBP was significant even after the adjustment, but the sBP was not. We also found that a cut-off of 120/75 mmHg made a significant difference in the stroke occurrence between the two groups (P=0.006,
Fig. 2). On the other hand, a dipper had no prognostic significance of a stroke. However, it should be considered that a dipping status has a low reproducibility and can be affected by antihypertensive drug treatment. However, there was no significant parameter that predicted the risk of ACS on the ABPM. On the other hand, in the case of HF, the mean daytime sBP predicted the risk of HF (HR=1.054, P=0.032;
Table 4). It was significant even after the adjustment of a known CVD history and known AF history (HR=1.089, P=0.050;
Table 4).
It has already been found that the nighttime BP has a closer relationship to cardiovascular risk [
17,
18]. In our study, the increase in the nighttime BP rather than the daytime BP increases the risk of a stroke, which is consistent with the fact that the nighttime BP is a more powerful prognostic factor. There are various hypotheses about the mechanism of why the nighttime BP had a better prognostic significance. Firstly, the decreased nocturnal arteriolar tone might lead to a greater impact on the small arteries supplying target organs during the elevation of the BP. When sleeping, organs need a minimal BP to get adequate perfusion, and the kidney’s afferent arteriolar tone becomes lower. However, a high BP at night can exceed the level of adequate perfusion and damage target organs such as the heart, vasculature, and kidneys [
19]. Secondly, there are some hypotheses that the harmful effect of increased sympathetic activity, sleep apnea, and BP dependent natriuresis are related [
17,
18]. Finally, the nighttime BP is less variable than the daytime BP, which can lead to accurate monitoring. During the daytime, physical and mental changes affect the BP, so the ABPM may not truly reflect the daytime averages [
20]. Also, the daytime BP decreases and becomes less predictive because antihypertensive medications are taken during the daytime [
18].
The 2017 American college of Cardiology / American Heart Association guidelines suggest that a nighttime BP of 120/70 mmHg in the ABPM corresponds to the hypertension criteria of 140/90 for the Clinic BP and this is based on the general population [
21]. In our study, the cut-off of 120/75 mmHg for the nighttime ABPM was found to be a significant prognostic factor for a population without AF.
This study had limitations in terms of the retrospectively collected data. The patients were not free from the effects of the medications. In addition, the study population was small, which was all collected in one hospital. Moreover, as this study targeted patients who underwent both Holter and ABPM monitoring, they might be a high-risk group for cardiovascular events. More cardiovascular events might have occurred than in the general population. Finally, silent AF patients without symptoms might not have been included in this study, because they usually are not tested.
4. Strength of the study
However, there were several strengths of this study. First, we used 24-hour ABPM to predict the risk factor of CVD. There was a clinical implication in that we revealed the relationship between the nighttime BP and strokes on the ABPM, which is frequently used in the outpatient setting. Secondly, unlike other previous studies, the Holter and ABPM were analyzed at the same time. There have been few studies interpreting the results of both tests. This study took the advantages of both test’s diagnostic sensitivity and accuracy. Finally, by excluding patients with AF, we offered a more reliable BP cut-off to predict strokes. AF itself is a strong risk factor for a stroke and its medications can affect the results.
5. Perspective
Further prospective studies should be performed to determine whether a tighter control of the nighttime BP affects the CVD morbidity and mortality reduction. Also, as this study suggested the nighttime BP cut-off in a population without AF, it is necessary to study the BP cut-off in a population with diagnosed AF. Considering that AF is a powerful risk factor of CVD, it might be necessary to select a different level of BP control.
6. Conclusion
In a population without AF, the nocturnal BP was a significant predictor of a stroke incidence. At this point, a cutoff value of 120/75 mmHg was advisable.
Acknowledgements
This research was supported by Basic Science Research Program through the National Research Foundation of Korea (NRF) funded by the Ministry of Science, ICT & Future Planning (NRF-2022R1A2C1093352), and by Institute of Information & communications Technology Planning & Evaluation (IITP) grant funded by the Korea government (MSIT) (No. RS-2022-00155966, Artificial Intelligence Convergence Innovation Human Resources Development [Ewha Womans University]), and supported by Basic Science Research Program through the National Research Foundation of Korea (NRF) funded by the Ministry of Science, ICT & Future Planning (NRF-2017R1E1A1A01078382).
Conflict of Interest
-
No potential conflict of interest relevant to this article was reported.
Author Contribution
-
Conceptualization: Park Junbeom
Formal Analysis: Park S, Park Jisoo, Choi Y
Investigation: Park S, Park Jisoo, Choi Y
Methodology: Park Junbeom
Project Administration: Park Junbeom
Writing – Original Draft: Park S, Park Jisoo, Choi Y
Writing – Review & Editing: Park S, Park Jisoo, Choi Y, Shin S, Park Junbeom
Ethics Approval and Consent to Participate
-
This study protocol was approved by the institutional review board of the Ewha Womans University Mokdong Hospital (IRB number: 2019-12-025-002).
Supplementary Materials
-
Supplementary materials are available from: https://doi.org/10.12771/emj.2023.e6.
Supplementary Table S1. General characteristics of the study population analyzed by the stroke morbidity
Supplementary Table S2. General characteristics of the study population analyzed by the ACS morbidity
Supplementary Table S3. General characteristics of the study population analyzed by the heart failure morbidity
Supplementary Table S4. OR and 95% CI of the ACS incidence according to the parameters of the 24-hour AMBP in people without atrial fibrillation
Supplementary Table S5. OR and 95% CI of the ACS incidence according to the parameters of the 24-hour Holter examination in people without atrial fibrillation
Supplementary Table S6. OR and 95% CI of the heart failure incidence according to the parameters of the 24-hour AMBP in people without atrial fibrillation
Supplementary Table S7. OR and 95% CI of the heart failure incidence according to the parameters of the 24-hour Holter examination in people without atrial fibrillation
Supplementary Table S8. OR and 95% CI of the cardiovascular disease incidence according to the parameters of the 24-hour AMBP in people without atrial fibrillation
Supplementary Table S9. OR and 95% CI of the cardiovascular disease incidence according to the parameters of the 24-hour Holter examination in people without atrial fibrillation
Supplementary Table S10. HR and 95% CI of the incidence of the total cardiovascular disease according to the 24-hour AMBP parameters analyzed by a Cox proportional hazard model
Supplementary Table S11. HR and 95% CI of the incidence of the cardiovascular diseases according to the 24-hour Holter examination parameters analyzed by a Cox proportional hazard model
References
- 1. Pickering TG, Shimbo D, Haas D. Ambulatory blood-pressure monitoring. N Engl J Med 2006;354:2368-2374.
- 2. Eguchi K, Pickering TG, Hoshide S, Ishikawa J, Ishikawa S, Schwartz JE, et al. Ambulatory blood pressure is a better marker than clinic blood pressure in predicting cardiovascular events in patients with/without type 2 diabetes. Am J Hypertens 2008;21((4)):443-450.
- 3. Galli A, Ambrosini F, Lombardi F. Holter monitoring and loop recorders: from research to clinical practice. Arrhythm Electrophysiol Rev 2016;5((2)):136-143.
- 4. Zimetbaum P, Goldman A. Ambulatory arrhythmia monitoring: choosing the right device. Circulation 2010;122((16)):1629-1636.
- 5. Paudel B, Paudel K. The diagnostic significance of the holter monitoring in the evaluation of palpitation. J Clin Diagn Res 2013;7((3)):480-483.
- 6. Shaffer F, Ginsberg JP. An overview of heart rate variability metrics and norms. Front Public Health 2017;5:258
- 7. Nelson BW, Allen NB. Accuracy of consumer wearable heart rate measurement during an ecologically valid 24-hour period: intraindividual validation study. JMIR Mhealth Uhealth 2019;7(3):e10828.
- 8. Lewalter T, Boriani G. Relevance of monitoring atrial fibrillation in clinical practice. Arrhythm Electrophysiol Rev 2012;1((1)):54-58.
- 9. Minutolo R, Gabbai FB, Chiodini P, Garofalo C, Stanzione G, Liberti ME, et al. Reassessment of ambulatory blood pressure improves renal risk stratification in nondialysis chronic kidney disease: long-term cohort study. Hypertension 2015;66((3)):557-562.
- 10. Paoletti E, Bellino D, Amidone M, Rolla D, Cannella G. Relationship between arterial hypertension and renal damage in chronic kidney disease: insights from ABPM. J Nephrol 2006;19((6)):778-782.
- 11. Scheppach JB, Raff U, Toncar S, Ritter C, Klink T, Störk S, et al. Blood pressure pattern and target organ damage in patients with chronic kidney disease. Hypertension 2018;72((4)):929-936.
- 12. Cho J. Current status and prospects of health-related sensing technology in wearable devices. J Healthc Eng 2019;2019:3924508
- 13. Wolf PA, Abbott RD, Kannel WB. Atrial fibrillation as an independent risk factor for stroke: the Framingham study. Stroke 1991;22((8)):983-988.
- 14. Kario K, Schwartz JE, Pickering TG. Changes of nocturnal blood pressure dipping status in hypertensives by nighttime dosing of α-adrenergic blocker, doxazosin: results from the HALT study. Hypertension 2000;35((3)):787-794.
- 15. Perloff D, Sokolow M, Cowan RM, Juster RP. Prognostic value of ambulatory blood pressure measurements: further analyses. J Hypertens Suppl Off J Int Soc Hypertens 1989;7(3):S3-S10.
- 16. Verdecchia P, Porcellati C, Schillaci G, Borgioni C, Ciucci A, Battistelli M, et al. Ambulatory blood pressure. An independent predictor of prognosis in essential hypertension. Hypertension 1994;24((6)):793-801.
- 17. de la Sierra A, Banegas JR, Segura J, Gorostidi M, Ruilope LM. Ambulatory blood pressure monitoring and development of cardiovascular events in high-risk patients included in the Spanish ABPM registry: the CARDIORISC event study. J Hypertens 2012;30((4)):713-719.
- 18. Boggia J, Li Y, Thijs L, Hansen TW, Kikuya M, Björklund-Bodegård K, et al. Prognostic accuracy of day versus night ambulatory blood pressure: a cohort study. Lancet 2007;370((9594)):1219-1229.
- 19. Roush GC, Fagard RH, Salles GF, Pierdomenico SD, Reboldi G, Verdecchia P, et al. Prognostic impact from clinic, daytime, and night-time systolic blood pressure in nine cohorts of 13,844 patients with hypertension. J Hypertens 2014;32((12)):2332-2340.
- 20. Fagard RH, Celis H, Thijs L, Staessen JA, Clement DL, De Buyzere ML, et al. Daytime and nighttime blood pressure as predictors of death and cause-specific cardiovascular events in hypertension. Hypertension 2008;51((1)):55-61.
- 21. Whelton PK, Carey RM, Aronow WS, Casey DE Jr, Collins KJ, Dennison Himmelfarb C, et al. 2017 ACC/AHA/AAPA/ABC/ACPM/AGS/APhA/ASH/ASPC/NMA/PCNA guideline for the prevention, detection, evaluation, and management of high blood pressure in adults: a report of the American College of Cardiology/American Heart Association task force on clinical practice guidelines. Hypertension 2018;71((6)):1269-1324.
Figure & Data
Citations
Citations to this article as recorded by