
Introduction
In children with short stature, growth hormone (GH) deficiency is characterized by a sub-normal increase in GH level after pharmacological stimulation. In general, a stimulated peak GH (PGH) level<10 ng/mL in two GH stimulation tests confirms GH deficiency (GHD). However, the GH stimulation test is a non-physiological test with a poor reproducibility and a high incidence of false-positive results [1,2].
The GH response to pharmacological stimulation varies with the stimulant type, state of GH secretion preceding the stimulus, age, puberty, and other physiological conditions [3]. Body mass index (BMI) also affects the stimulated PGH level [4–7].
The spontaneous and stimulated GH levels are lower in obese children [8,9] and adults [10,11] than in normal controls. Therefore, the possibility of the over-diagnosis of GHD in obese people has been raised [12].
Despite these limitations, GH stimulation tests have been widely used as the most useful method to diagnose GHD.
GH is the main promoter of skeletal growth and has several metabolic functions, such as the regulation of body composition, protein synthesis, and glucose and lipid metabolism [13,14].
Previous studies have found that obesity and metabolic derangements are related to GHD in adults [15–18]. Obesity and metabolic syndrome are common in patients with adult-onset GHD and adolescents with childhood-onset GHD who discontinued GH treatment after epiphyseal closure [19–21].
Although several studies of children with GHD have shown a reciprocal relationship between the stimulated PGH level and BMI, only a few studies have investigated the relationships between the stimulated PGH level and metabolic parameters in children with GHD [22–24]. In most of these studies, metabolic markers are limited to a certain type of metabolic disturbance, and the participants’ age varied, mostly including adolescents during and after puberty.
The present study investigated the relationship between the stimulated PGH level and comprehensive metabolic markers, including insulin resistance index, lipid profiles, AST, and ALT levels in prepubertal children with GHD.
Methods
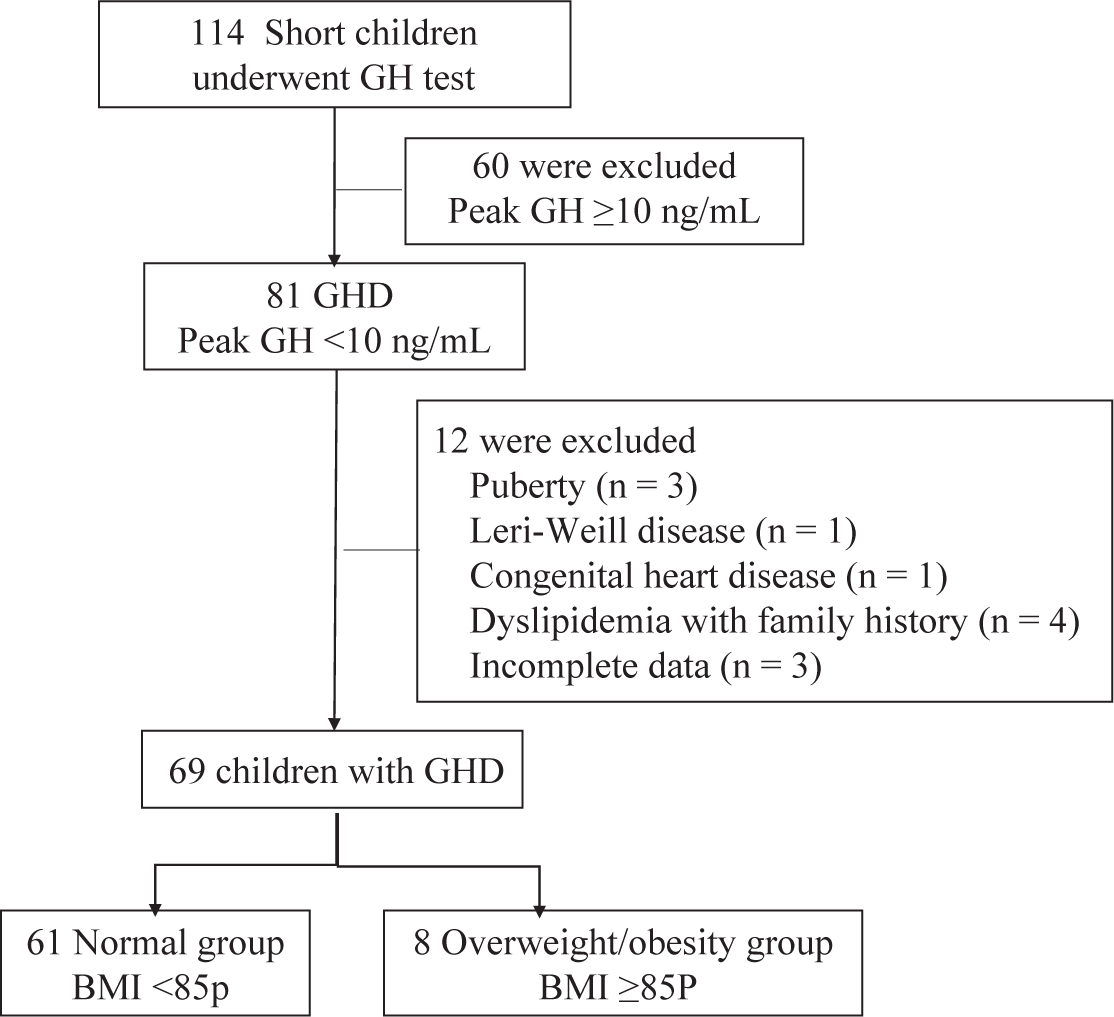
The medical records of 141 children who underwent GH stimulation tests between June 2018 and August 2022 at a single hospital were retrospectively reviewed. Sixty children with a PGH level≥10 ng/mL after GH stimulation were excluded. In total, 81 children were diagnosed with GHD (PGH level<10 ng/mL).
None of the patients had multiple pituitary hormone deficiencies or chronic diseases. After excluding three adolescents undergoing puberty, two children with congenital abnormalities (one each with Leri Weill disease and congenital heart disease), four children with hyperlipidemia with a family history, and three patients with incomplete data, 69 GHD patients were included (Fig. 1).
Children with isolated GHD with no other pituitary hormone deficiency were included in this study, even if they had brain MRI abnormalities. These included mild anterior pituitary hypoplasia, Rathke cleft cyst, arachnoid cyst, pineal cyst, and septum cavum pellucidum in 26, 10, 1, 1, and 1 patient, respectively.
Height was measured using a Harpenden Stadiometer (Holtain, Crymych, UK) and recorded to the nearest 0.1 cm. Weight was measured using an electronic scale (CAS, Seoul, Korea) and recorded to the nearest 0.1 kg. BMI was calculated as weight (kg) divided by height squared (m2). The SD scores (SDS) for height, weight, and BMI were calculated using the 2017 Korean National Growth Chart [25]. Bone age was calculated using the Greulich-Pyle method.
GH stimulation tests were performed after an overnight fast using two stimulants, including insulin, L-dopa, and arginine (insulin/L-dopa, insulin/arginine, and L-dopa/arginine in 5, 1, and 63 patients, respectively).
After 12 hr of fasting, the lipid profile and insulin-like growth factor 1 (IGF1), insulin, glucose, AST and ALT levels were measured according to the GH test protocol of SMG-SNU Boramae Medical center.
The IGF1, GH, and insulin levels were measured using immunoradiometric assays (IRMAs) (IGF1 IRMA Kit: Immunotech S.R.O., Prague, Czech Republic; GH IRMA Kit: Institute of isotopes, Budapest, Hungary; Insulin IRMA Kit: DIAsource ImmunoAssay, Louvain-la-Neuve, Belgium). The total cholesterol (TC), HDL-cholesterol (HDL-C), TG, and glucose levels were analyzed using standard enzymatic methods (Cobas 8000 c702; Roche, Rotkreuz, Switzerland).
AST and ALT levels were measured using absorbance assay (Cobas 8000 c702; Roche).
The LDL-cholesterol (LDL-C) level was determined using the Friedewald equation: LDL-C=TC−HDL-C−TG/5 [26].
The insulin resistance index was calculated as: homeostatic model assessment-insulin resistance (HOMA-IR)=(glucose [mg/dL]×insulin [IU/L]/405) [27].
Statistical analyses were performed using SPSS software (version 27.0; IBM, Armonk, NY, USA). Variables are presented as means±SD or medians and interquartile ranges. The nonparametric Wilcoxon Rank-Sum test was used to compare variables between the groups. Pearson correlation analysis was used to determine the correlations of PGH level with clinical and metabolic parameters. Linear regression analyses were performed to evaluate the relationships between metabolic parameters and PGH level. A multivariate regression model was constructed based on the variables with P<0.05 in the univariate analysis and possible covariates such as age, sex, and BMI SD score. P<0.05 was considered statistically significant.
Results
Table 1 presents the clinical and laboratory characteristics of the study participants.
SDS, SD score; BMI, body mass index; PGH-T, peak growth hormone level determined by two stimulation tests; PGH-L, peak growth hormone level stimulated by L-dopa; PGH-A, peak growth hormone level stimulated by arginine; IGF1, insulin-like growth factor 1; HOMA-IR, homeostatic model assessment-insulin resistance; HDL-C, HDL-cholesterol; LDL-C, LDL-cholesterol.
Of the 69 GHD children, 42 (60.1%) were males and 27 (39.1 %) were females; 3 (4.3%) children were obese (BMI≥95th percentile) and 5 (7.2%) were overweight (85th≤BMI<95th percentile). In total, 8 (11.6%) children with overweight or obesity were included in the overweight/obesity group.
None of the children had an abnormally high glucose level (>100 mg/dL), whereas 3 children (4.3%) had high insulin levels (>15 mIU/L) and 6 children (8.7%) had a HOMA-IR>3.
Hypercholesterolemia (TC>200 mg/dL and/or LDL-C>130 mg/dL) was present in 7 (10.1%) children. Hypertriglyceridemia (TG>150 mg/dL) and low HDL-C (<40 mg/dL) were present in 4 (5.8%) and 2 (2.9%) children, respectively. In total, 10 (14.5%) children had dyslipidemia.
None of the study participants had a high AST (>40 IU/L) or ALT (>40 IU/L) level. One patient had an AST level of 40 IU/mL, and another had an ALT level of 40 IU/mL.
The height, weight, and BMI were higher in the overweight/obesity group than in the normal group (Table 2). The PGH level determined by two stimulation tests (PGH-T), PGH level stimulated by L-dopa (PGH-L) and PGH level stimulated by arginine (PGH-A) were lower in the overweight/obesity group than in the normal group, albeit without statistical significance (PGH-T, 5.22 vs. 7.01 ng/mL, P=0.139; PGH-L, 4.20 vs. 5.12 ng/mL, P=0.261; PGH-A, 4.50 vs. 5.05 ng/mL, P=0.543).
SDS, SD score; BMI, body mass index; PGH-T, peak growth hormone level determined by two stimulation tests; PGH-L, peak growth hormone level stimulated by L-dopa; PGH-A, peak growth hormone level stimulated by arginine; IGF1, insulin-like growth factor 1; HOMA-IR, homeostatic model assessment-insulin resistance; HDL-C, HDL-cholesterol; LDL-C, LDL-cholesterol.
The HOMA-IR, TC, TG, and ALT levels were higher and HDL-C level was also lower in the overweight/obesity group than in the normal group, but there was no statistical significance. The LDL-C level was significantly higher in the overweight/obesity group than in the normal group (P=0.044).
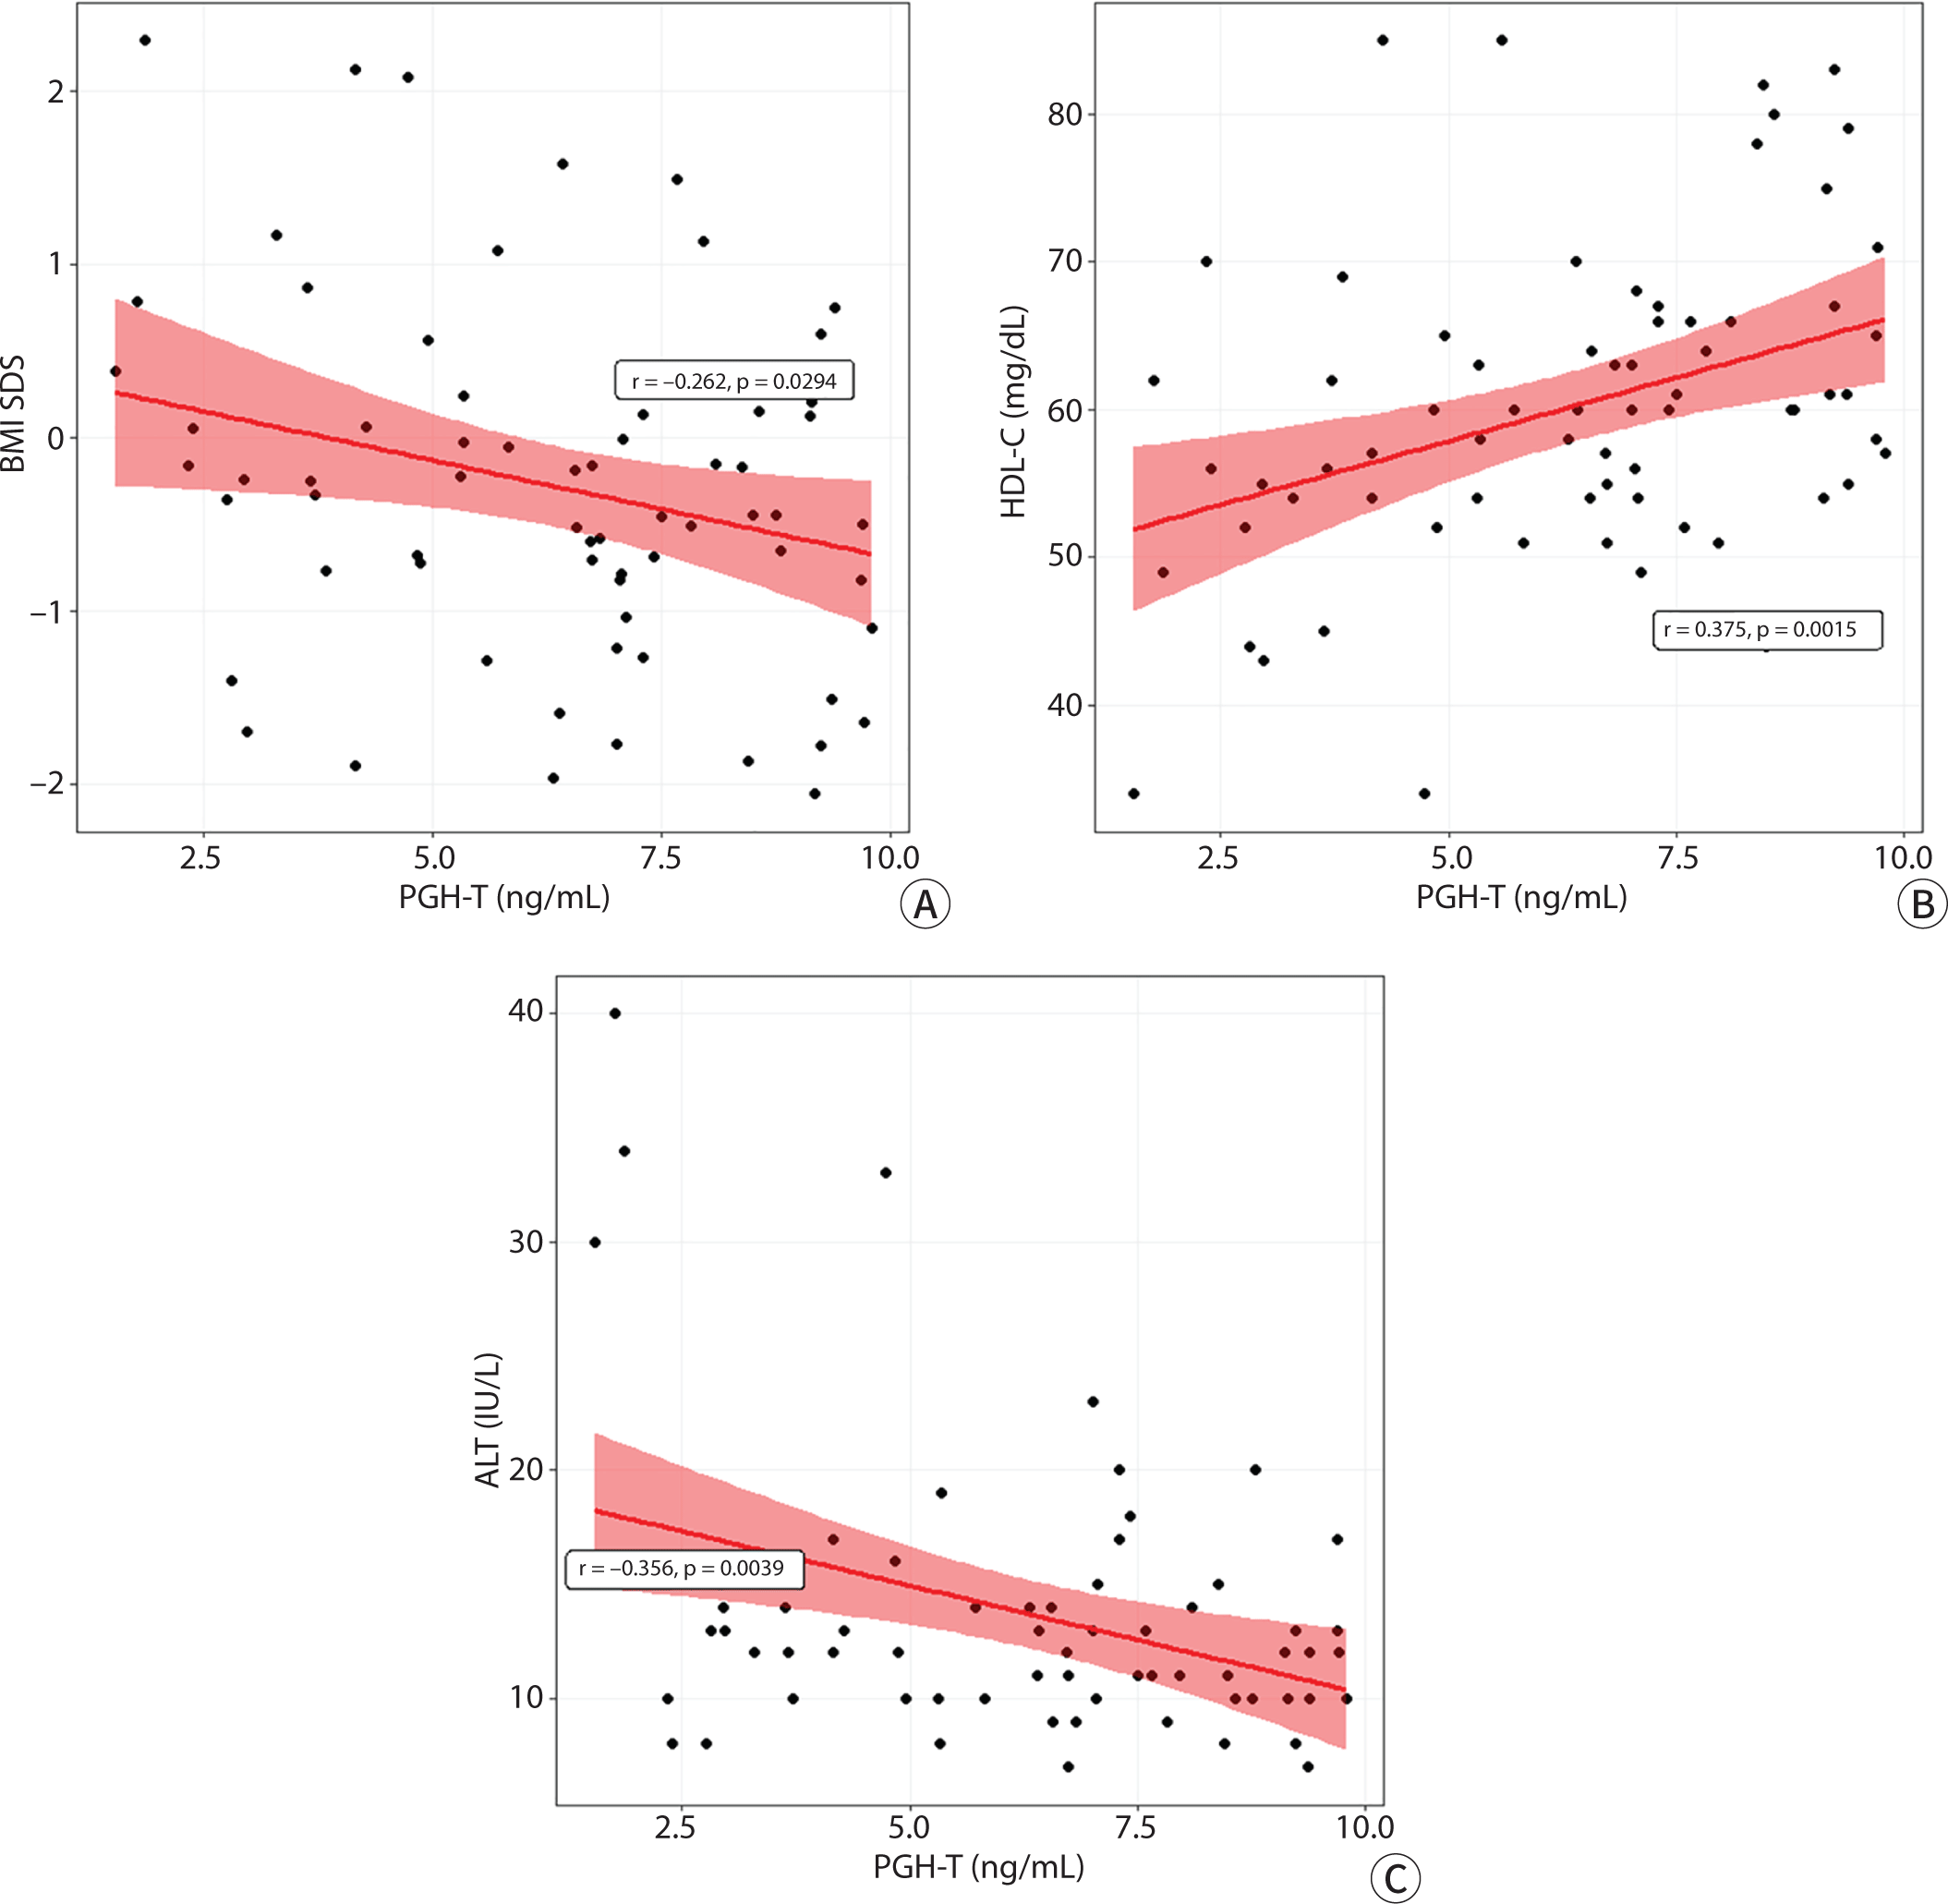
Correlation analysis showed that PGH-T level was negatively associated with BMI SDS (r=−0.26, P=0.029). The PGH-T was positively associated with the HDL-C level (r=0.38, P=0.002) and negatively associated with the ALT level (r=−0.36, P=0.004) (Fig. 2). In a partial correlation analysis controlled by BMI SDS, PGH-T level was also positively and negatively associated with the HDL-C (r=0.34, P=0.005) and ALT (r=−0.29, P=0.021) levels, respectively.
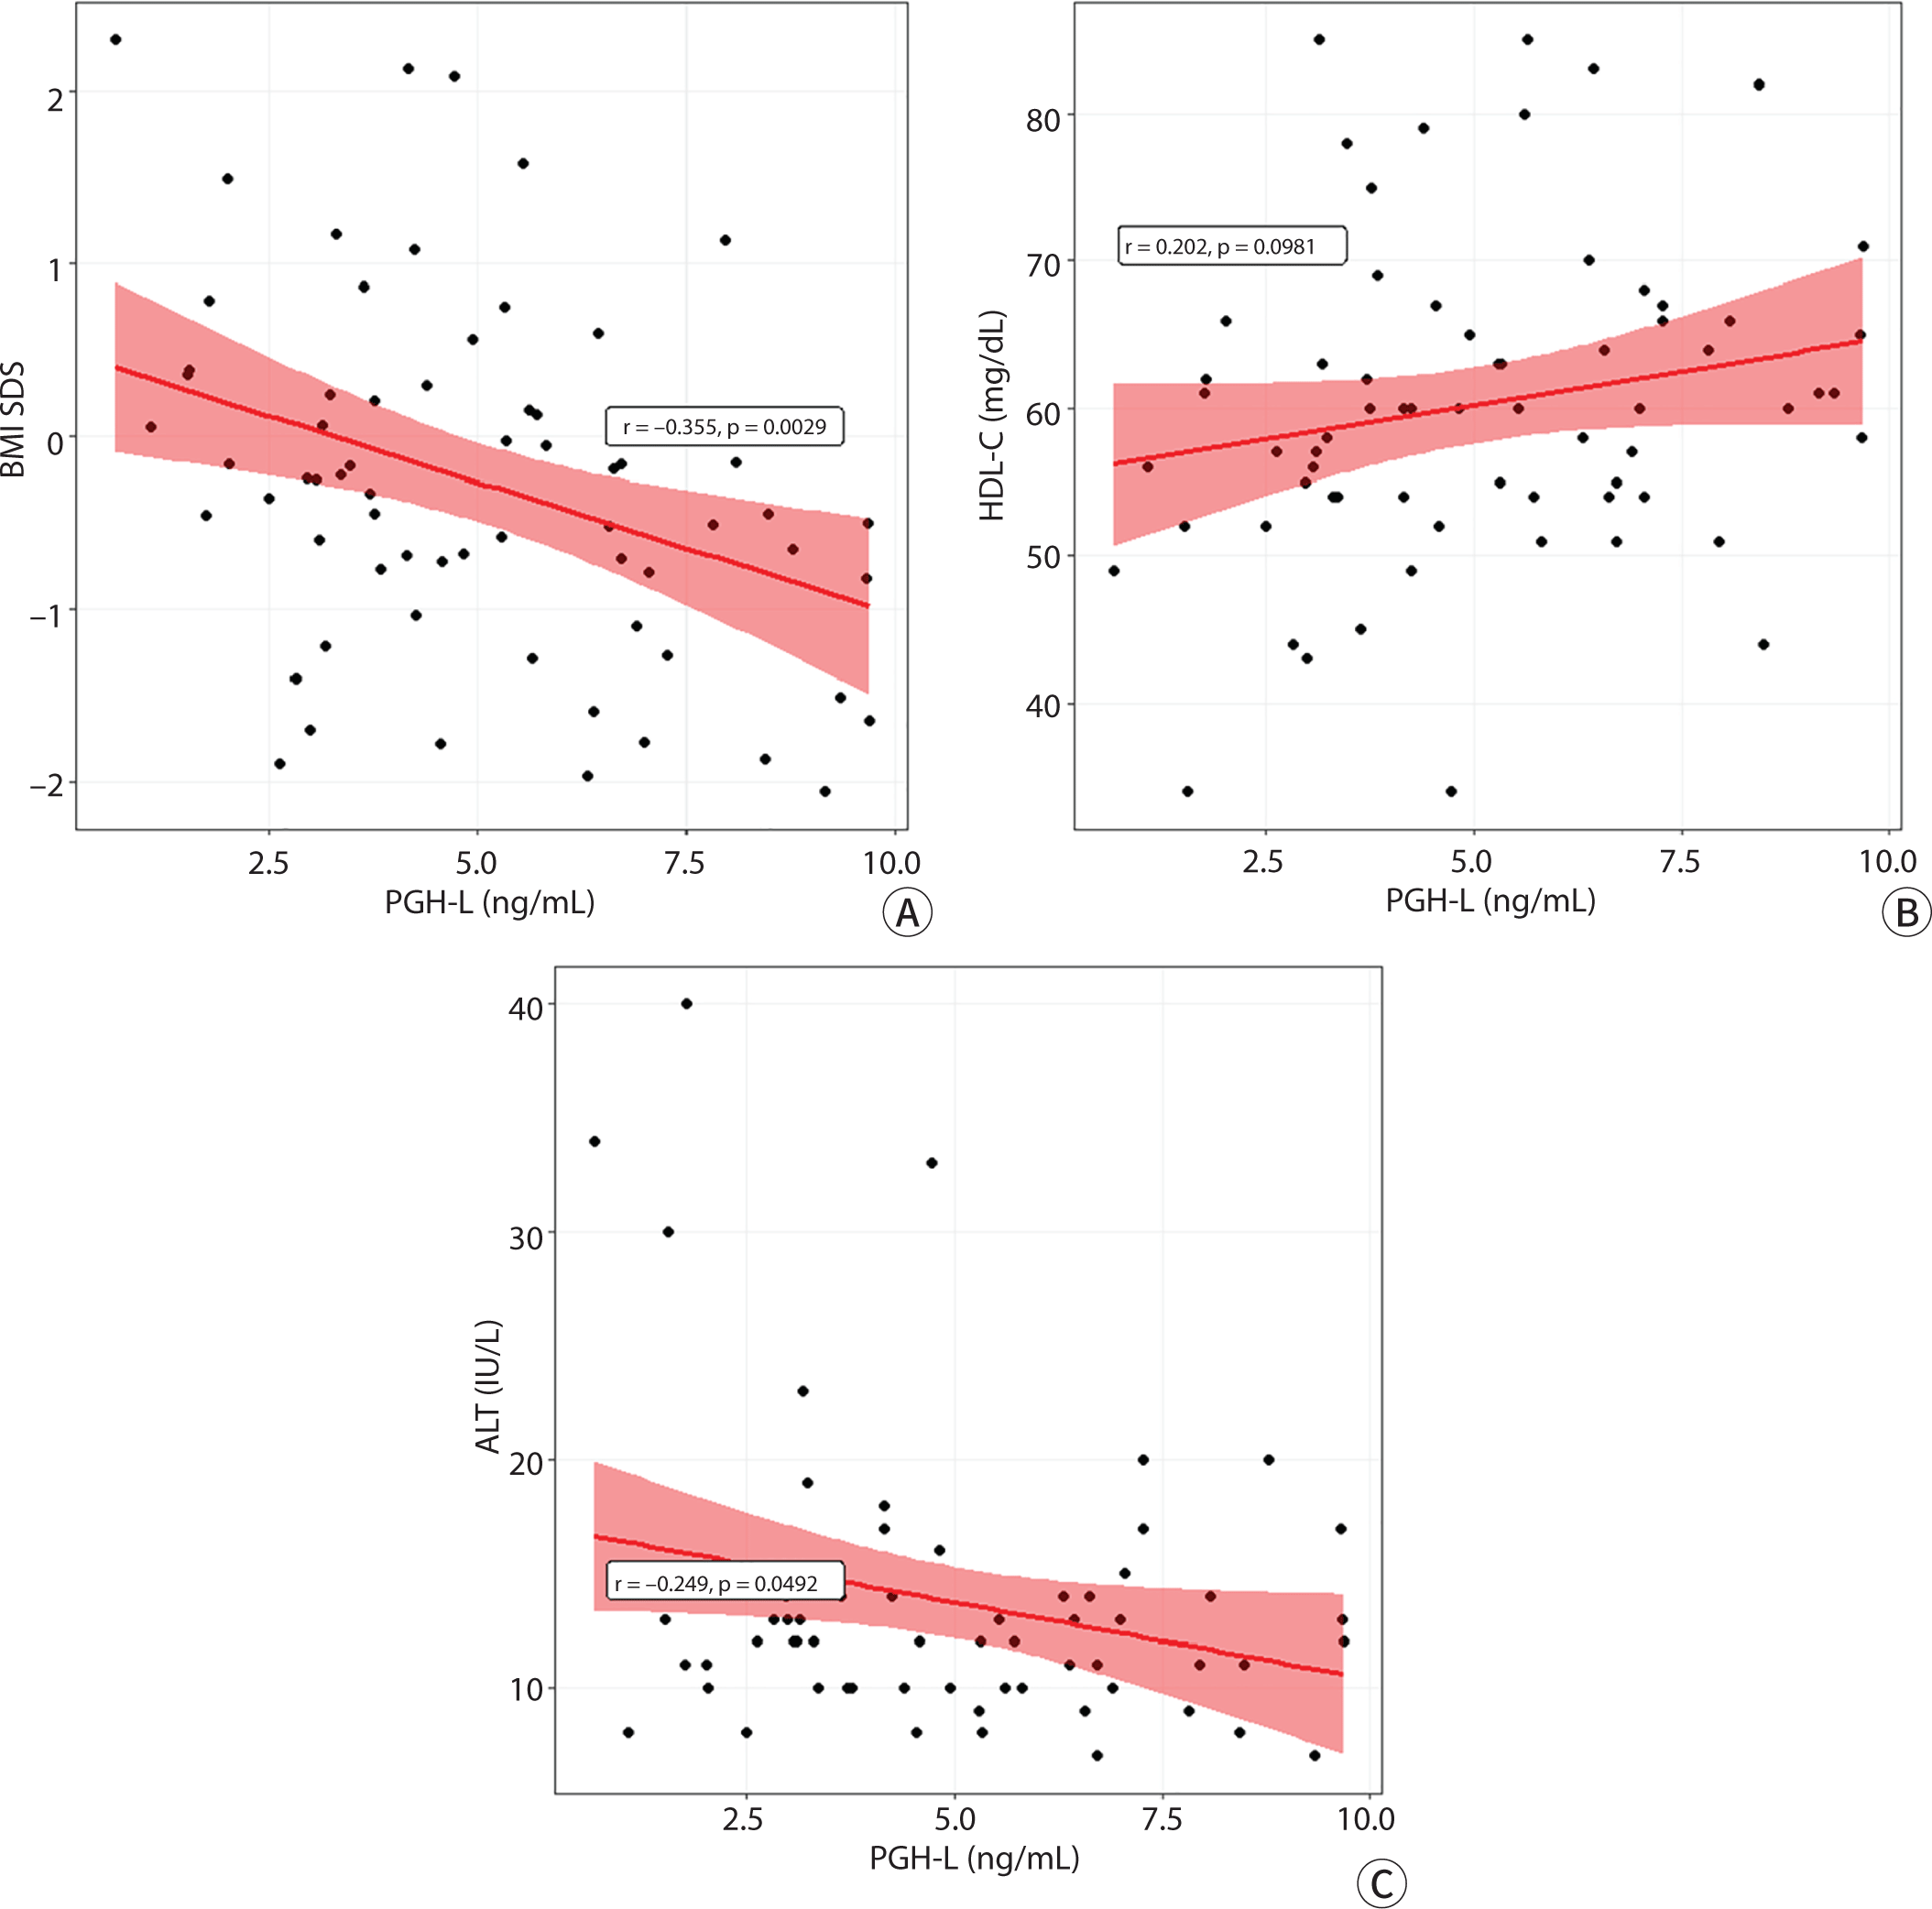
The PGH-L was also negatively associated with, BMI SDS (r=−0.36, P=0.003) and the ALT level (r=-0.25, P=0.049) (Fig. 3). However, PGH-L was not associated with the ALT level controlled by BMI SDS (r=−0.14, P=0.267).
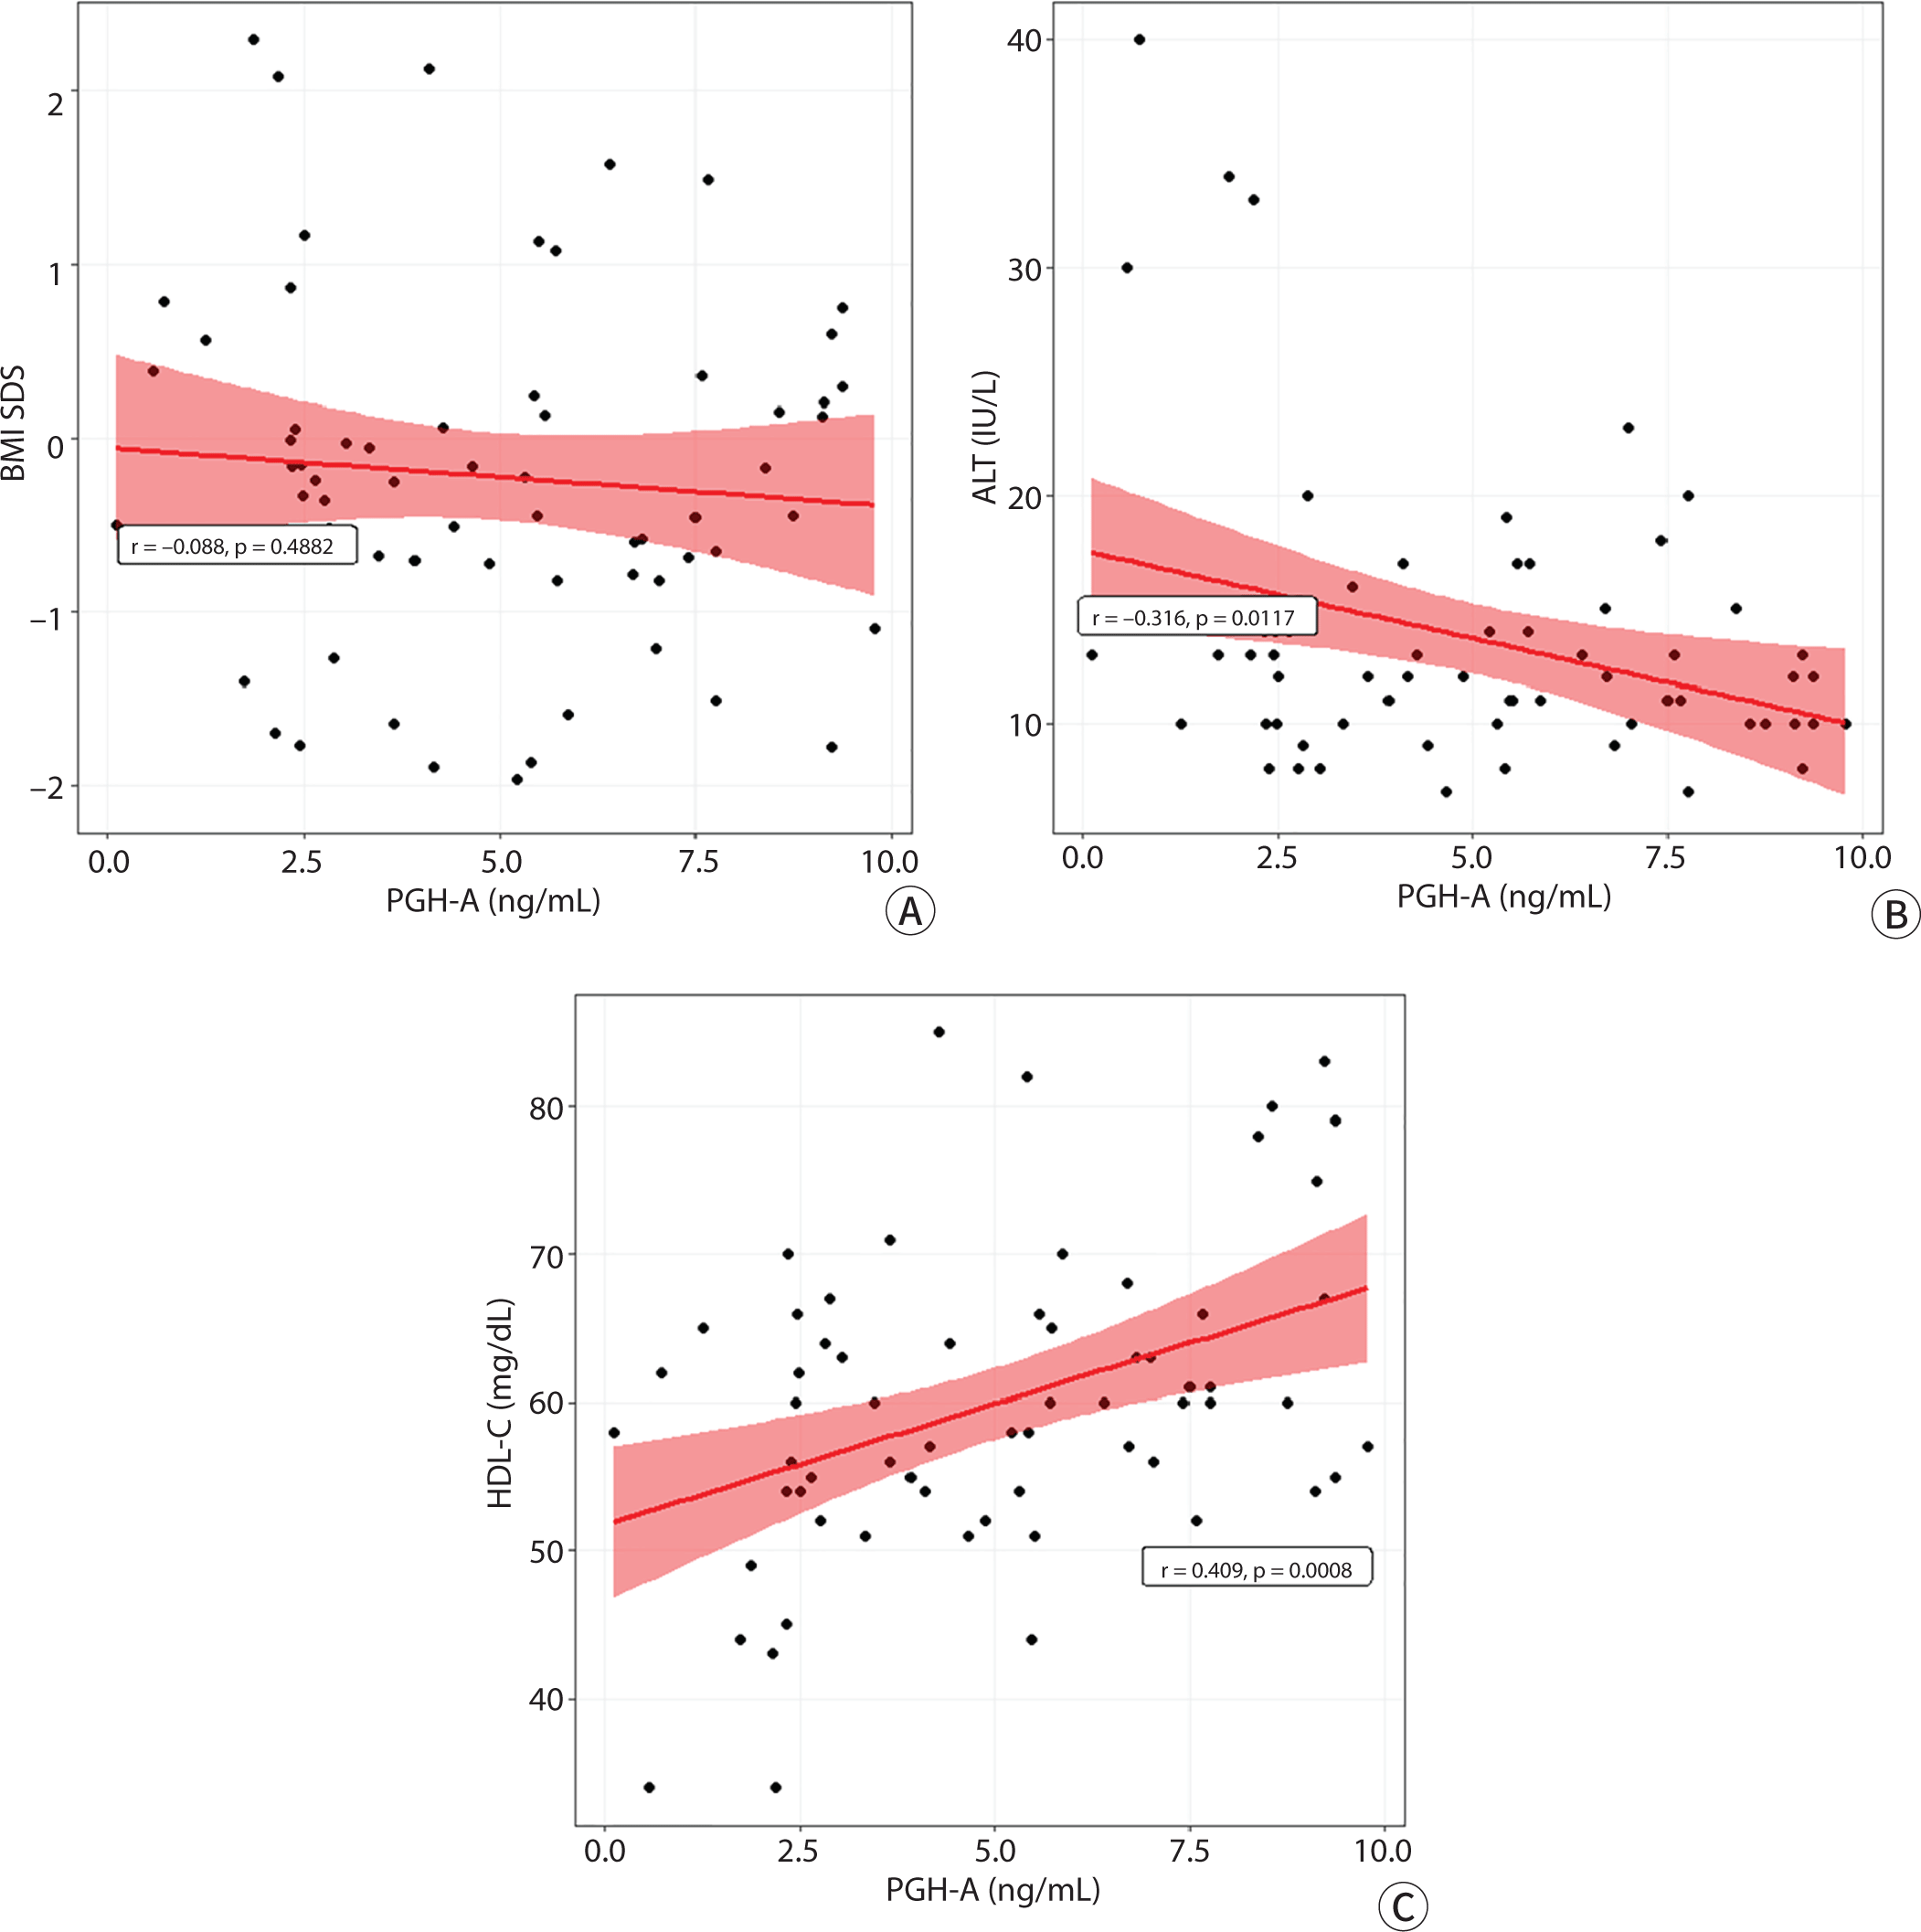
The PGH-A was not associated with BMI SDS but was positively and negatively associated with the HDL-C (r=0.41, P=0.001) and ALT (r=−0.32, P=0.012) levels, respectively (Fig. 4).
Fasting insulin, glucose levels, and HOMA-IR were not correlated with the PGH-T, PGH-L, and PGH-A levels (Table 3).
PGH-T, peak growth hormone level determined by two stimulation tests; PGH-L, peak growth hormone level stimulated by L-dopa; PGH-A, peak growth hormone level stimulated by arginine; SDS, SD score; BMI, body mass index; IGF1, insulin-like growth factor 1; Ln IGF1, log-transformed insulin-like growth factor 1; HOMA-IR, homeostatic model assessment-insulin resistance; HDL-C, HDL-cholesterol; LDL-C, LDL-cholesterol.
Tables 4 and 5 present the results of univariate and multivariate linear regression analyses with HDL-C and ALT levels as dependent variables, respectively.
BMI, body mass index; SDS, SD score; PGH-T, peak growth hormone level determined by two stimulation tests; PGH-L, peak growth hormone level stimulated by L-dopa; PGH-A, peak growth hormone level stimulated by arginine; HOMA-IR, homeostatic model assessment-insulin resistance; HDL-C, HDL-cholesterol.
Univariate analysis showed that the HDL-C level was positively associated with the PGH-T and PGH-A, and was negatively associated with the TG and ALT levels.
In multivariate analyses, PGH-T was a significant predictor of the HDL-C (P=0.002) after adjusting for age, sex, BMI SDS, HOMA-IR, TG, and ALT levels. PGH-A, not PGH-L, also was a significant predictor of the HDL-C (P=0.003).
In univariate analyses, the ALT level was negatively associated with the PGH-T, PGH-L, PGH-A, and HDL-C levels, and was positively associated with the BMI-SDS, HOMA-IR, and TG levels.
In multivariate analyses, each PGH-T and PGH-A, not PGH-L, was a significant predictor of ALT (PGH, P=0.028; PGH-A, P=0.049) levels, after adjusting for age, sex, BMI SDS, HOMA-IR, TG, and HDL-C levels.
Discussion
Similar to previous studies, the present study shows an inverse relationship between the PGH level and BMI SDS in children with GHD. The stimulated PGH level had an independent positive association with the HDL-C level and a negative association with the ALT level, after adjusting for BMI SDS in prepubertal children with GHD.
The PGH level was lower in children in the overweight/obesity group than in those in the normal group, although statistical significance was not reached, possibly due to the small number of overweight and obese participants.
GH is a counter-regulatory hormone of insulin and is involved in glucose metabolism. GH promotes gluconeogenesis and IGF1 production. During fasting and catabolic states, GH induces lipolysis to produce free fatty acid, which switch the metabolism from glucose and protein utilization to lipid utilization to preserve the lean body mass. GH also has anabolic effects on protein synthesis directly and indirectly via IGF1 [13].
In GHD, glucose metabolism varies according to age, puberty, and body composition. Children with GHD have increased insulin sensitivity, which manifests as low glucose and insulin levels, and low HOMA-IR [28–30]. In adolescents with GHD who have reached their final height, withdrawal of GH therapy decreased the fasting glucose and insulin levels, and HOMA-IR [19,21]. However, a study of obese children and adolescents showed that PGH level was negatively correlated with HOMA-IR [24].
In adult GHD patients, the insulin level and HOMA-IR were higher compared to the normal controls. Furthermore, the PGH level was inversely correlated with the fasting insulin level and HOMA-IR [15].
The differences in glucose metabolism between GHD adults and children may be due to the physiological changes in insulin resistance with age and body composition. Insulin sensitivity decreases with age and the progression of puberty.
Nonetheless, most GHD patients maintain a normal glucose level irrespective of their insulin level [28].
In the present study, fasting insulin, fasting glucose level, and HOMA-IR were not correlated with the PGH level. These findings may be due to the young age and normal BMI of most study participants. There was no difference in glucose level between the overweight/obesity and normal groups, whereas the HOMA-IR was higher in the overweight/obesity group, but there was no statistical significance (P=0.094).
In GHD and normal adults, a low PGH level was associated with an abnormal lipid profile [15,16,31,32]. Previous studies have reported that GHD children had higher serum TC, LDL-C, and TG levels, and a lower HDL-C level, compared to controls [22,23]. The PGH level was negatively associated with the TC and TG levels in children with short stature, regardless of the presence or absence of GHD [33]. The discontinuation of GH therapy increased the serum TC, LDL-C, and non-HDL-C levels in GHD adolescents [19].
In the present study, the PGH-T level was negatively and positively associated with BMI and the HDL-C levels, respectively. In the partial correlation analysis corrected for BMI and multiple regression analysis, the PGH-T level was also related to the HDL-C level. However, the HDL-C level was lower, but without significance, whereas the LDL-C level was significantly higher in the overweight/obesity group than in the normal group.
Previous studies have also found a significant positive relationship between the PGH and HDL-C levels in normal [32] and GHD adults [15] and in GHD children [24]. Additionally, GH treatment in GHD children and adolescents increased the HDL-C level [23].
These results suggest that the PGH level has a stronger relationship with the HDL-C level than with other lipid parameters.
NAFLD is significantly related to obesity, insulin resistance, and a low IGF1 level [34]. A high prevalence of NAFLD was found in GHD adults [17,18] and adolescents [20]. Obese adults with NAFLD have a lower PGH level compared to healthy controls with a similar BMI [35], additionally, GH treatment is associated with a decreased ALT level in NAFLD adults [17].
In the present study, the ALT level was negatively correlated with the PGH-T level, and the PGH-T level was a significant factor that affected the ALT level in multiple regression analysis, although most participants had a normal ALT level (<40 IU/L).
Few studies have evaluated the presence of NAFLD in GHD children due to the very low prevalence of NAFLD in young children. A recent study reported a negative association between PGH level and ALT level in short children and adolescents without NAFLD [36].
Meanwhile, slightly different results were found when examining the relationship between metabolic parameters with PGH according to the type of stimulants.
PGH-L had a negative association with BMI SDS and ALT level, but not with HDL-C level. PGH-A did not show the relationship with BMI SDS but a positive and negative association with HDL-C and ALT levels, respectively.
Stimulated GH levels by Insulin and clonidine were not evaluated because the number of study was small.
This study had several limitations. First, this was a retrospective cross-sectional cohort study that did not include comparisons with a control group. Second, the number of obese and overweight children with a GHD was small. Additional significant relationships and differences between the groups may be identified in future studies with a large sample size.
Third, pre-pubertal children are usually less prone to metabolic abnormalities. Most of the metabolic parameters in these study participants were within the normal range or showed minimal abnormalities. Further studies are needed that include a large number of children with obvious metabolic abnormalities such as insulin resistance, dyslipidemia and NAFLD.
Fourth, the reliability of GH stimulation tests is uncertain. The PGH level may vary depending on the stimulant used. In the present study, L-dopa and arginine were the most commonly used stimulants, and the highest GH level among the two tests was recorded as the PGH-T level, regardless of the stimulant type used.
Nevertheless, this study provides a meaningful analysis of the relationships between the PGH level and comprehensive metabolic parameters related with insulin resistance, dyslipidemia, and fatty liver, although their levels were within the normal range, in pre-pubertal children with GHD.
The results of this study suggest that among various metabolic parameters, HDL-C and ALT are the most significant metabolic markers related with PGH in children with GHD. However, the relationship between PGH level and HDL-C and ALT was slightly different according to the kind of stimulants.
In conclusion, a low PGH level in pre-pubertal children with GHD is associated with low HDL-C and high ALT, even if they were within normal range, regardless of BMI.
The results of this study suggest that the more severe the GHD, the more likely it is to develop metabolic disturbance such as dyslipidemia and fatty liver. Therefore, patients with GHD with low PGH concentration will need follow-up tests for metabolic abnormalities.