Abstract
-
Purpose
This study aimed to characterize co-occurrence patterns, statistical associations, and phenotypic clusters of clinical manifestations reported in human toxocariasis case reports indexed in PubMed from 2005 through 2025, inclusive.
-
Methods
PubMed-indexed case reports from 2005 through 2025 were identified using the query (“Toxocariasis” OR “Toxocara”) AND “Case Reports” [Publication Type] AND 2005:2025[dp] AND ffrft[Filter]. Free full-text articles were retrieved through PubMed Central and other links indexed in PubMed using the ffrft filter. After 7 nonhuman reports and 5 reports without objective diagnostic confirmation were excluded, 139 case reports were included. Antigravity was used to support data extraction, standardization, statistical analysis, and figure generation. Clinical features were mapped to standardized symptom and organ-involvement variables. Pairwise co-occurrence was assessed using 2×2 contingency tables and Fisher’s exact test; association strength was measured using Pearson correlation coefficients; and k-means clustering was used to identify distinct clinical phenotypes.
-
Results
Four principal clusters were identified: subclinical disease, ocular larva migrans, visceral larva migrans, and neurotoxocariasis/multisystemic disease. The ocular larva migrans and visceral larva migrans clusters were largely distinct, whereas ocular features were frequently co-reported in the neurotoxocariasis/multisystemic cluster. Eosinophilia was strongly associated with systemic manifestations, including fever, dyspnea, cough, pruritus, hepatomegaly, headache, and meningitis, but was not significantly associated with ocular features. Neurotoxocariasis-related features, including headache, meningitis, and seizures, clustered closely.
-
Conclusion
This artificial intelligence-assisted scoping review identified exploratory clinical association and clustering patterns in human toxocariasis case reports. These findings may support clinical awareness, but they require validation in curated clinical datasets before they are used for diagnosis, risk stratification, or practice guidance.
-
Keywords: Toxocariasis; Parasitology; PubMed; Cluster analysis; Artificial intelligence
Introduction
Background/rationale
Toxocariasis is a prevalent zoonotic parasitosis caused by
Toxocara canis or
Toxocara cati infection and can present with diverse clinical manifestations, which may contribute to missed or delayed diagnosis [
1]. Although toxocariasis is often asymptomatic, it is traditionally classified into 2 well-defined clinical syndromes: visceral larva migrans, which involves systemic larval migration through major organs, and ocular larva migrans, which specifically affects the eye and optic nerve [
2]. In addition to these classical syndromes, individual case reports have described atypical manifestations of toxocariasis, including pleural effusion [
3]. Although some studies have examined associations between specific toxocariasis manifestations and related clinical features, large-scale systematic analyses evaluating the broader clinical patterns among classical and atypical manifestations reported in toxocariasis case reports remain limited.
This study aimed to elucidate correlations and clustering patterns among diverse clinical manifestations reported in toxocariasis case reports indexed in PubMed from 2005 through 2025, inclusive. Specifically, it addressed the following question: What symptoms and organ-involvement patterns are reported in toxocariasis case reports, and how do they cluster?
Methods
Ethics statement
This was a literature-based study; therefore, institutional review board approval and informed consent were not required.
Study design
This systematic scoping review was reported in accordance with the Preferred Reporting Items for Systematic Reviews and Meta-Analyses Extension for Scoping Reviews guidelines, which are available at
https://www.prisma-statement.org/scoping.
No review protocol was registered for this scoping review.
Eligibility criteria, information sources, and search strategy
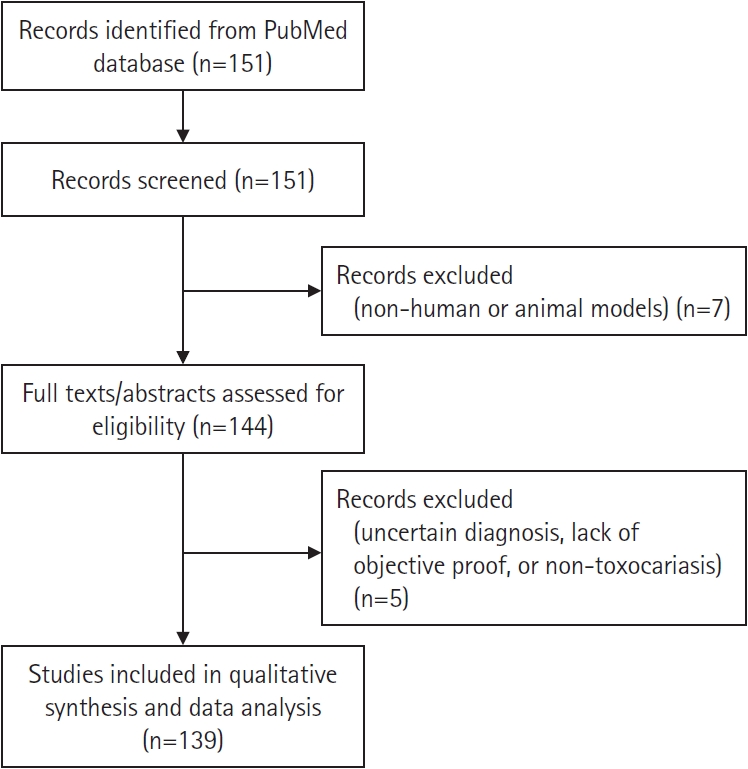
Human toxocariasis case reports indexed in PubMed between January 1, 2005, and December 31, 2025, were identified (n=151) using the query (“Toxocariasis”[Title/Abstract] OR “Toxocara”[Title/Abstract]) AND “Case Reports” [Publication Type] AND 2005:2025[dp] AND ffrft[Filter]. Free full-text articles were retrieved through PubMed Central or other free full-text links provided in PubMed using the ffrft filter. Seven nonhuman case reports involving cats, dogs, a foal, an opossum, or other animals were excluded using Antigravity-supported screening. Subsequently, 5 reports were excluded because objective diagnostic confirmation, such as positive serology, larval identification, histopathologic confirmation, or other explicit diagnostic evidence, could not be verified. The final 139 human case reports were used for data analysis and generation of the results (
Dataset 1). All inclusion and exclusion decisions were supported by algorithmic extraction logic and cross-verified by the author.
The final 139 human case reports were analyzed after the following variables had been extracted into a structured CSV format: PubMed identifier, patient age, sex, chief complaint, associated symptoms, eosinophil count, and final diagnosis. Standardization followed a predefined pipeline: free-text symptom descriptors were first normalized into canonical labels and then mapped to Medical Subject Headings (MeSH) terms when applicable, whereas organ involvement was coded separately using explicit evidence statements, such as imaging findings or specialist examination findings, rather than symptom keywords alone.
Selection of sources of evidence
Retrieved records were screened sequentially for human case-report status, relevance to toxocariasis, and objective diagnostic confirmation. For diagnostic confirmation, the mere mention of a diagnostic modality, such as “ELISA performed,” was not considered sufficient unless confirmatory results or definitive diagnostic statements were explicitly reported. Nonhuman reports were excluded, as were reports describing suspected or insufficiently documented toxocariasis without clear diagnostic evidence, such as serology, larval identification, histopathology, biopsy findings, or other explicit confirmation. Antigravity supported the initial screening by applying predefined inclusion and exclusion logic, and the author manually verified the artificial intelligence-generated decisions by reviewing titles, abstracts, and full texts. Ambiguous records were assessed conservatively and excluded when the diagnosis or human case-report status could not be confirmed. The final set included 139 confirmed human toxocariasis case reports. Exclusion reasons are summarized in
Fig. 1 and
Supplement 1.
A structured CSV-based charting form was developed to extract bibliographic information, patient characteristics, clinical manifestations, eosinophil count or eosinophilia status, organ involvement, diagnostic evidence, final diagnosis, inclusion status, and extraction source. Antigravity generated preliminary extraction outputs from titles and abstracts and then refined these outputs using the retrieved free full-text articles.
Pilot charting was conducted to refine variable definitions, identify false-negative extractions, and standardize heterogeneous clinical terminology. Free-text symptom descriptions were mapped to standardized symptom labels and organ-involvement domains. Missing values were coded as “not reported,” “not available,” or “unable to extract.” The author manually verified the artificial intelligence-generated charting outputs against the original sources and corrected misclassified or incomplete variables. The finalized charted dataset of 139 confirmed human case reports was then used for association analysis, correlation analysis, and k-means clustering.
Data items
Operational definitions were designed to minimize circularity between symptom variables and organ-involvement variables. Organ-involvement variables were coded only when reports explicitly indicated organ involvement, such as through imaging findings, specialist examinations, or diagnostic statements, and were not assigned solely on the basis of symptom terms that were coded separately as symptoms, including cough, dyspnea, headache, seizures, and meningitis.
• Age: expressions such as “years old” and “months old.”
• Organ_Eye: Keywords “eye,” “ocular,” “retina,” “vision,” “uveitis,” “macula,” “blindness,” “optic.”
• Organ_Liver: Keywords “liver,” “hepatic,” “hepatomegaly.”
• Organ_Lung: Keywords “lung,” “pulmonary,” “pleura/pleural,” “pneumon-,” “infiltrate,” “consolidation,” “effusion,” “ARDS,” “respiratory failure.”
• Organ_CNS: Keywords “brain,” “central nervous system,” “CNS,” “cerebral,” “intracranial,” “encephal-,” “myel-,” “spinal,” “CSF,” “meningeal enhancement.”
• Organ_Heart: Keywords “heart,” “cardiac,” “myocarditis.”
Because some organ variables partially overlapped with symptom terminology, symptom–organ pairs with direct definitional overlap were not interpreted as independent associations. Nonstandard symptom expressions were mapped to MeSH terms. For example, pyrexia, shortness of breath, vision loss, and itching were mapped to fever, dyspnea, blindness, and pruritus, respectively. Eosinophilia values were extracted from full-text sentences that explicitly contained numeric laboratory thresholds or diagnostic terminology such as hypereosinophilia. Manual confirmation by the author identified data that had been misclassified by the artificial intelligence agent. Prompts instructed Antigravity to reevaluate missing data and extract additional information from the full texts.
Critical appraisal of individual sources
Formal methodological quality or risk-of-bias appraisal of individual case reports was not performed. Because this scoping review aimed to map clinical manifestations and clustering patterns rather than synthesize treatment effects or estimate pooled prevalence, no case report was excluded on the basis of reporting quality. However, eligibility required objective diagnostic confirmation of toxocariasis, and artificial intelligence-generated extraction outputs were manually checked by the author.
Synthesis of results
Three exploratory analyses were performed using the finalized binary clinical-feature matrix: (1) pairwise association testing with Fisher’s exact test and odds ratios, (2) pairwise correlation analysis using phi/Pearson’s r for binary features, and (3) k-means clustering to identify phenotypic patterns. Symptoms and organ-involvement variables were coded as present or absent for each included case report. Variables reported in fewer than 2 cases were excluded from pairwise analysis to reduce instability from sparse cells.
For pairwise association analysis, 2×2 contingency tables were constructed for a prespecified set of clinically relevant feature pairs (n=39) that met the minimum frequency requirement, with each feature reported in at least 2 cases. Fisher’s exact test was used to assess departure from independence. Odds ratios and 95% confidence intervals were calculated to estimate the direction, magnitude, and precision of associations. Directional interpretation was not inferred from the Fisher’s exact test P-value alone. “Positive” indicated higher observed co-occurrence than expected under independence, generally corresponding to an odds ratio greater than 1; “negative” indicated lower observed co-occurrence than expected, generally corresponding to an odds ratio less than 1. Given the exploratory nature of this scoping review, Bonferroni or false discovery rate corrections were not applied to individual P-values because the primary goal was pattern identification rather than hypothesis testing. Unadjusted P-values should therefore be interpreted with caution. Confidence intervals for odds ratios were computed using an exact method; therefore, nominal P-values and confidence intervals may not align perfectly after rounding, particularly for sparse tables.
Pearson correlation coefficients were calculated between binary feature pairs. For 2 binary variables, Pearson’s r is equivalent to the phi coefficient. Correlation heatmaps summarized association strength and direction, whereas Fisher’s exact test summarized statistical evidence against independence. K-means clustering was then applied to the binary clinical-feature matrix, with k=4 selected on the basis of clinical interpretability and data-driven validation metrics, including the elbow method and silhouette score (
Supplement 2). This analysis identified 4 clinically interpretable phenotypic groups: subclinical disease, ocular larva migrans, visceral larva migrans, and neurotoxocariasis/multisystemic disease. Analyses were performed using Python libraries, including pandas, SciPy, and scikit-learn. The source code for the Antigravity-supported analysis used in this study is available in
Supplement 3.
Results
Selection of sources
The case-report selection process for data analysis is shown in
Fig. 1.
The final evidence set included 139 confirmed human toxocariasis case reports indexed between 2005 and 2025. The included reports contained patient-level information on age, sex, chief complaint, associated symptoms, eosinophil count or eosinophilia status, organ involvement, diagnostic evidence, and final diagnosis. Full-text articles were used for extraction. The reports covered diverse clinical presentations, including ocular larva migrans, visceral larva migrans, neurotoxocariasis or multisystemic disease, and subclinical or oligosymptomatic presentations. Detailed source-level characteristics and inclusion status are summarized in
Supplement 1.
No formal appraisal was performed; therefore, no appraisal results are presented.
Results of individual sources
Individual source-level charting results are presented in
Supplement 1. The charted variables included PubMed identifier, title, patient age, sex, chief complaint, associated symptoms, eosinophil count or eosinophilia status, final diagnosis, raw abstract, and inclusion status. The included reports covered heterogeneous toxocariasis manifestations, including ocular, visceral, neurologic, cardiopulmonary, hepatic, and subclinical or oligosymptomatic presentations. Aggregate co-occurrence, association, and clustering findings are reported separately below.
Pairwise co-occurrence and association analysis
Pairwise co-occurrence and association analyses were performed using the binary clinical-feature matrix derived from the 139 included human toxocariasis case reports.
Table 1 presents co-occurrence counts, odds ratios, 95% confidence intervals, Fisher’s exact test P-values, and directional classifications for selected pairs of toxocariasis-related clinical features. Directional classification was based on observed-versus-expected co-occurrence under independence and the corresponding odds ratio, not on the Fisher’s exact test P-value alone.
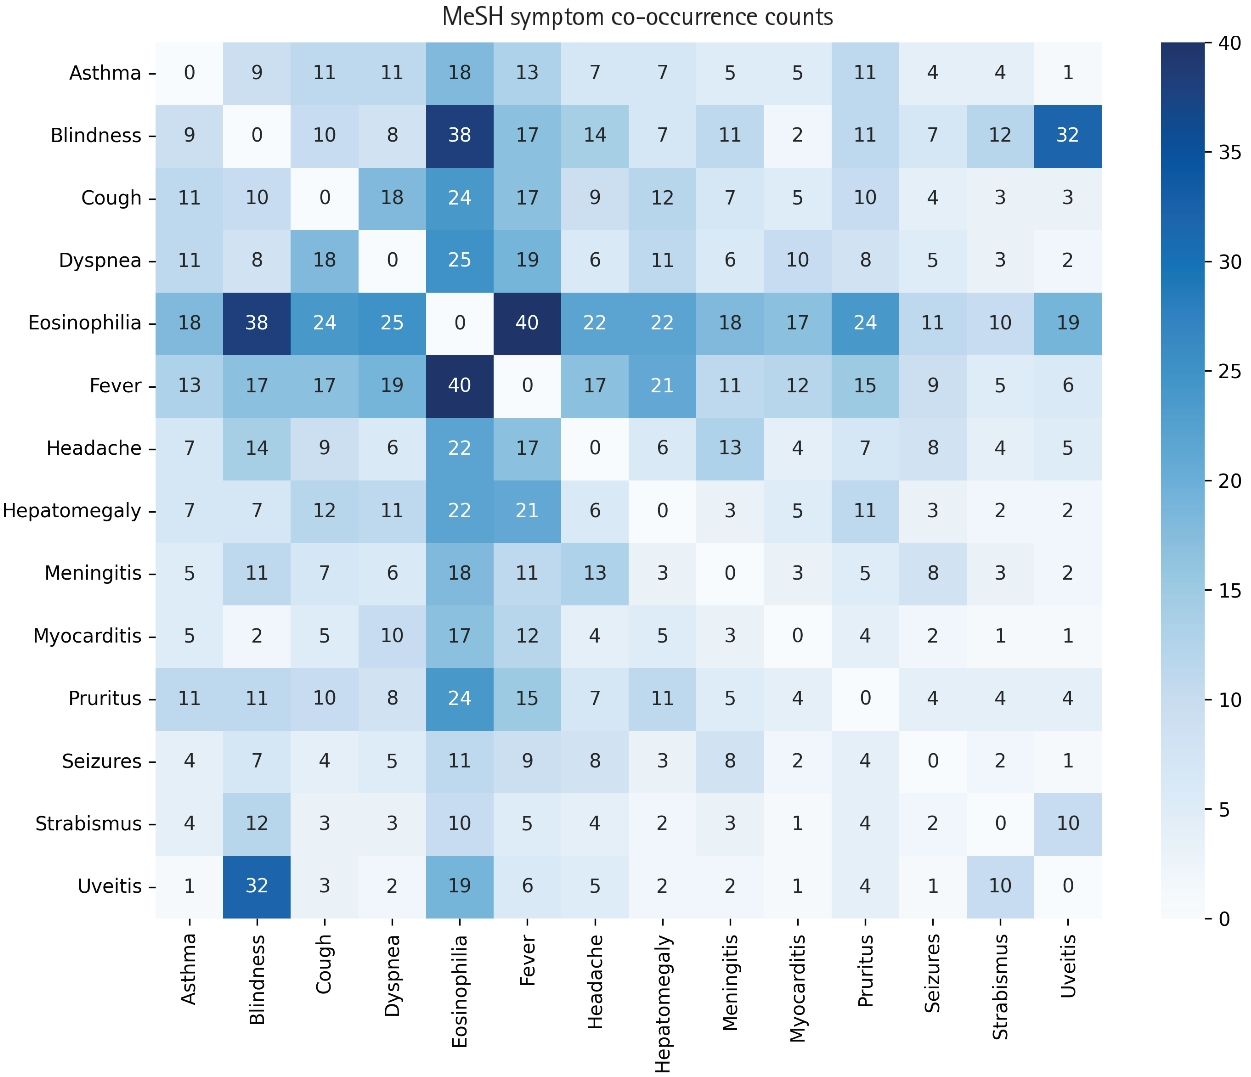
The highest co-occurrence counts were observed for eosinophilia with fever, blindness with uveitis, dyspnea with eosinophilia, cough with eosinophilia, eosinophilia with pruritus, and eosinophilia with headache. Pairs classified as positive showed higher observed co-occurrence than expected under independence and odds ratios greater than 1. Pairs classified as negative showed lower observed co-occurrence than expected under independence and odds ratios less than 1. Fisher’s exact test was used to assess the nominal statistical significance of departure from independence.
The “Interpretation” column reflects observed-versus-expected co-occurrence, not a direct output of Fisher’s exact test. Fisher’s exact test provides the P-value for independence. Because many feature pairs were sparse, odds ratios and confidence intervals were estimated using exact methods and are reported with rounding. In rare instances, different feature pairs can yield numerically similar estimates after rounding. The underlying 2×2 tables for all reported pairs are provided in
Supplement 4. An infinite odds ratio indicates a zero-cell count in the corresponding 2×2 table, and the Haldane-Anscombe correction was not applied.
To summarize nominal evidence against independence, clinical-feature pairs were grouped according to Fisher’s exact test P-values. P-values were classified into descriptive tiers (0.01<P≤0.05 and P<0.01) without adjustment for multiple comparisons; these tiers were intended for descriptive reporting only (
Table 2). These classifications were used only to summarize the distribution of P-values across feature pairs.
Cluster analysis
K-means clustering with k=4 identified 4 phenotypic clusters among the 139 included case reports (
Table 3). Cluster 1 included 62 cases and was labeled subclinical disease. The only distinguishing feature reported in more than 15% of cases in this cluster was eosinophilia. Cluster 2 included 29 cases and was labeled ocular larva migrans. The distinguishing features were blindness, uveitis, eosinophilia, and strabismus. Cluster 3 included 30 cases and was labeled visceral larva migrans. The distinguishing features were fever, eosinophilia, hepatomegaly, dyspnea, cough, asthma, pruritus, myocarditis, and headache. Cluster 4 included 18 cases and was labeled neurotoxocariasis/multisystemic disease. The distinguishing features were eosinophilia, blindness, meningitis, headache, fever, seizures, cough, dyspnea, asthma, pruritus, myocarditis, hepatomegaly, and strabismus.
The high prevalence of blindness in Cluster 4 suggests that some ocular larva migrans cases may have overlapped with this predominantly systemic/neurotoxocariasis cluster. This overlap reflects the hard boundaries imposed by k-means clustering; therefore, these programmatic clusters should be interpreted with the understanding that ocular larva migrans and neurotoxocariasis have distinct pathophysiological mechanisms.
Heatmap-based synthesis
Fig. 2 presents the co-occurrence counts for pairs of toxocariasis-associated clinical features. The diagonal represents self-co-occurrence and was set to zero by design to improve visualization of off-diagonal values. Higher co-occurrence counts are represented by darker cells.
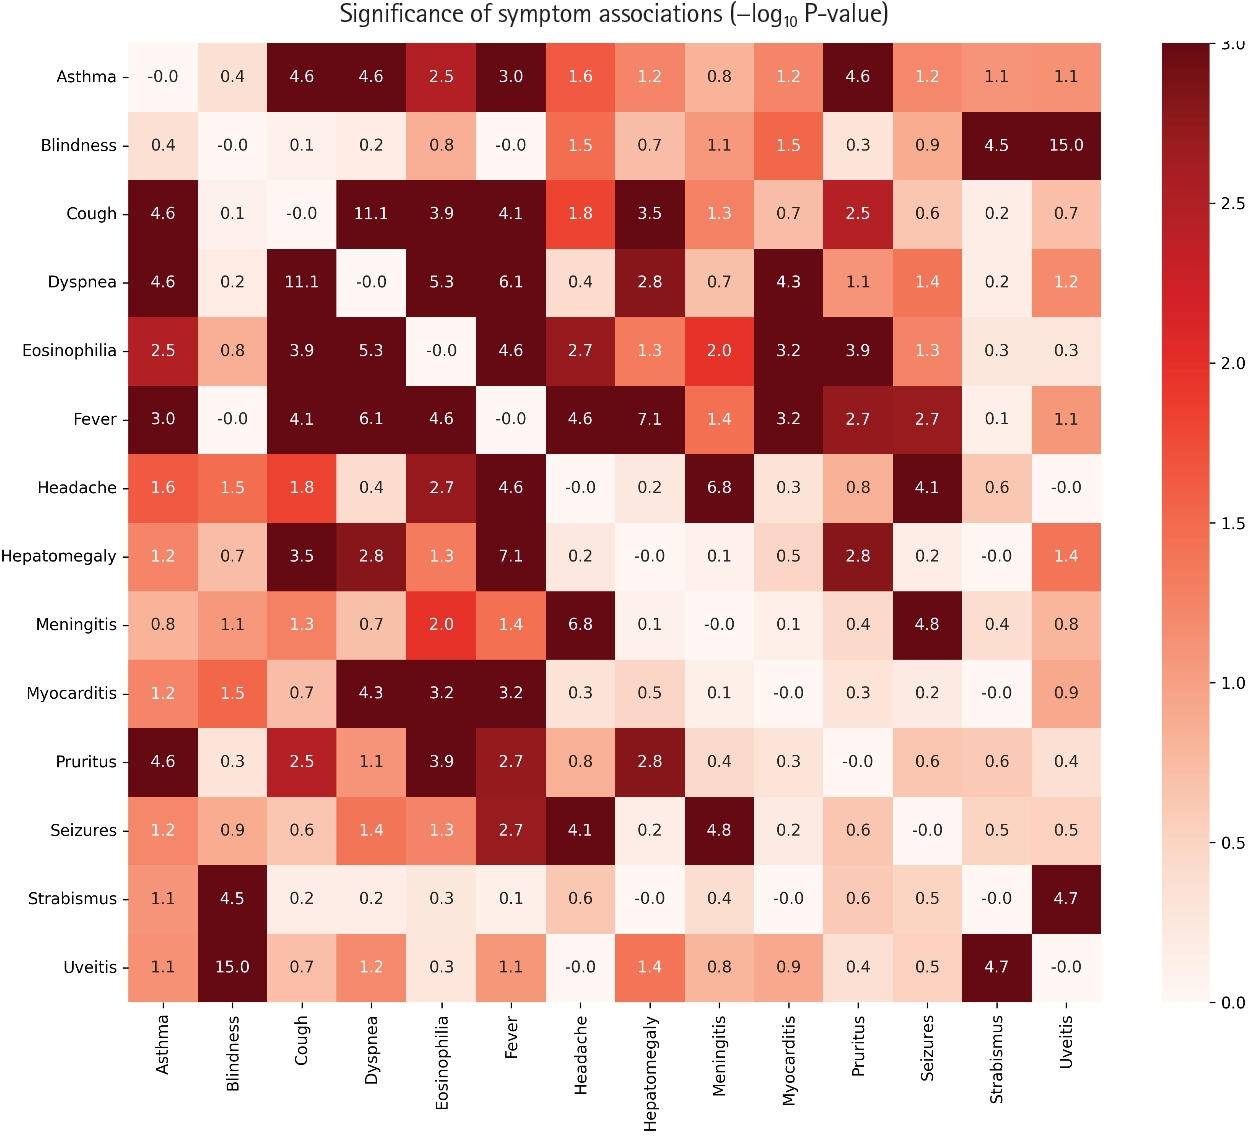
Fig. 3 presents the statistical significance of pairwise associations using −log
10-transformed P-values derived from Fisher’s exact test. Lower P-values correspond to higher −log
10-transformed P-values and darker cells in the heatmap.
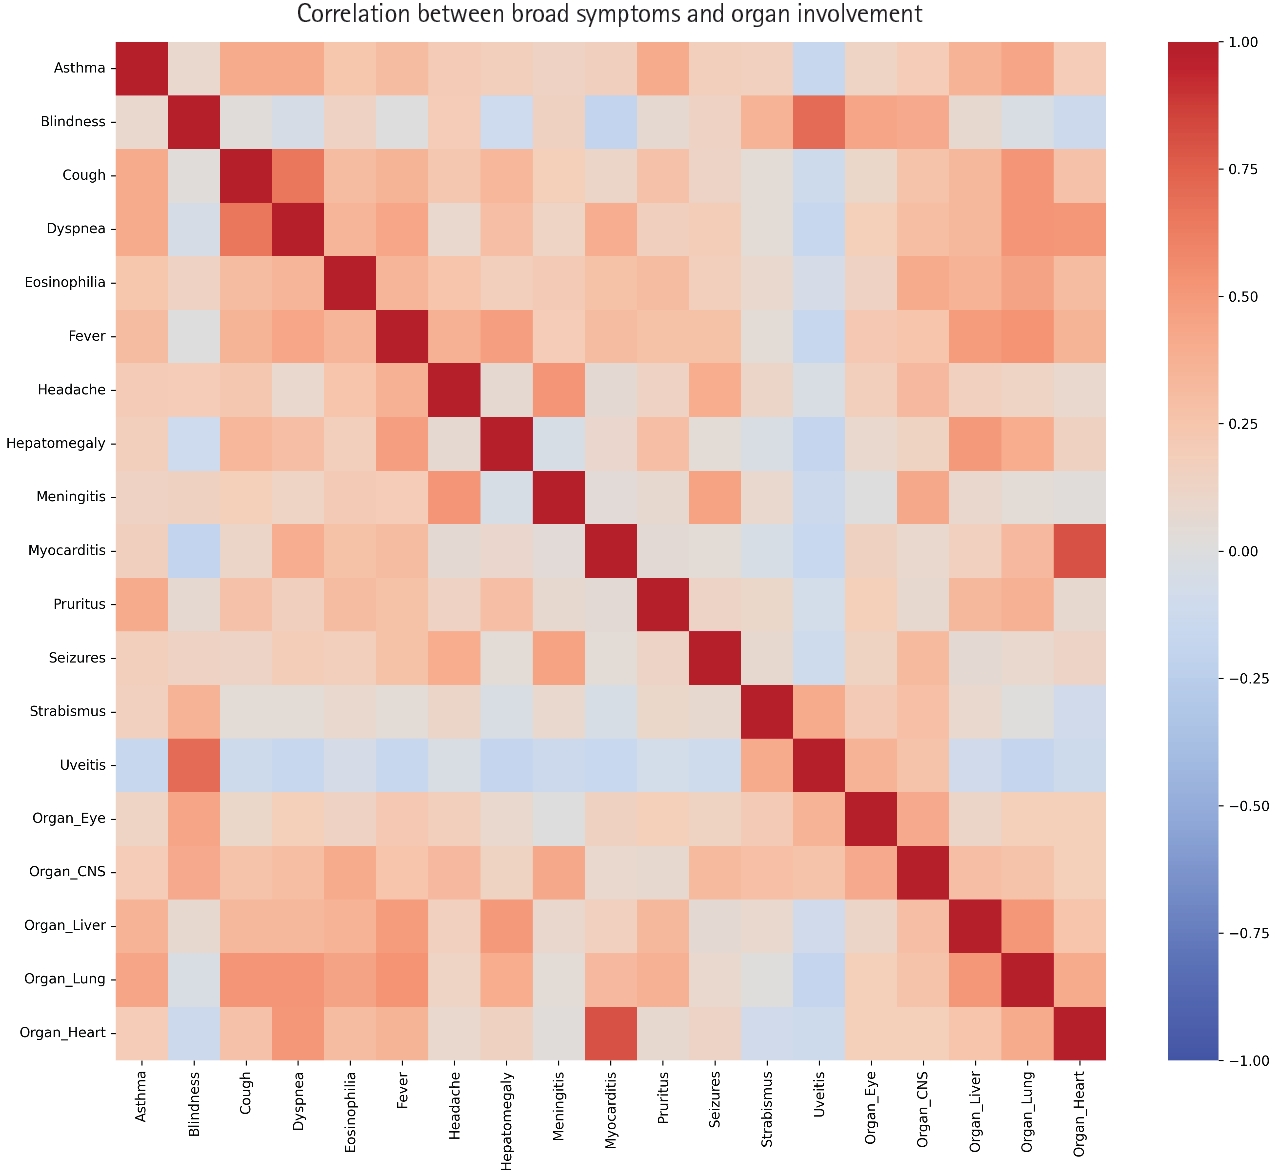
Fig. 4 presents Pearson correlation coefficients between binary clinical features. For 2 binary variables, Pearson’s r is equivalent to the phi coefficient. The correlation heatmap was used to summarize the strength and direction of association between feature pairs, whereas Fisher’s exact test was used to assess departure from independence.
Discussion
Summary of evidence
This Antigravity-assisted systematic scoping review summarized co-occurrence, association, correlation, and clustering patterns among clinical features reported in 139 human toxocariasis case reports indexed in PubMed. The findings suggest that reported manifestations of human toxocariasis can be organized into several clinically recognizable phenotypic patterns, including subclinical or oligosymptomatic presentations, ocular larva migrans, visceral larva migrans, and neurotoxocariasis/multisystemic disease.
The pairwise association and clustering results indicated that ocular and visceral phenotypes were relatively distinct in the included case reports. Ocular features, particularly blindness, uveitis, and strabismus, tended to cluster together, whereas systemic features such as fever, dyspnea, cough, hepatomegaly, pruritus, and eosinophilia aligned more closely with visceral or multisystemic presentations. These findings are consistent with the established clinical distinction between ocular larva migrans and visceral larva migrans [
2]. However, because the data were derived from case reports rather than a prospectively assembled clinical cohort, these patterns should be interpreted as descriptive and hypothesis-generating.
In pairwise Fisher’s exact tests, eosinophilia was not statistically significantly associated with ocular features; however, eosinophilia was reported in a subset of ocular cases, and multivariate clustering can group cases with partial overlap across domains. This discrepancy reflects the difference between univariate, feature-by-feature association testing and clustering, which groups cases according to overall similarity across multiple features.
This finding suggests that eosinophilia may be more informative for systemic toxocariasis presentations than for isolated ocular disease. Previous reports have also described variability in eosinophilia among patients with ocular toxocariasis [
4,
5]. Nevertheless, the presence of eosinophilia in some cases assigned to the ocular larva migrans cluster indicates that ocular-predominant cases may overlap with systemic manifestations. Therefore, eosinophilia should not be used alone to distinguish ocular from visceral toxocariasis.
The neurotoxocariasis/multisystemic cluster included central nervous system features, including headache, meningitis, and seizures, alongside systemic and ocular manifestations. This pattern suggests that neurotoxocariasis reported in the case-report literature may often occur in a broader multisystemic clinical context rather than as an isolated neurologic presentation. The observed clustering pattern should be interpreted cautiously because k-means clustering groups cases according to overall feature similarity and does not assign strict clinical diagnoses.
The complementary use of Fisher’s exact test, odds ratios, Pearson correlation coefficients, and k-means clustering provided different perspectives on the same binary clinical-feature matrix. Fisher’s exact test assessed departure from independence, odds ratios estimated the direction and magnitude of associations, Pearson correlation coefficients summarized association strength, and k-means clustering identified exploratory phenotypic groupings. These methods support descriptive pattern recognition but do not establish causality, diagnostic performance, or clinical prediction.
Limitations
This study has several limitations. First, the analysis was restricted to case reports indexed in PubMed and filtered by free full-text availability, which may have introduced database, language, publication, and full-text availability biases. Mild, asymptomatic, or common presentations may have been underrepresented because case reports typically emphasize unusual or severe manifestations. Second, data were extracted from published narratives rather than standardized clinical records. Symptoms, eosinophil counts, diagnostic methods, organ involvement, treatment, and outcomes were reported inconsistently, and unreported findings could not always be distinguished from true absence. Third, binary coding of heterogeneous clinical descriptions enabled association and clustering analyses but reduced clinical granularity and may have introduced misclassification during symptom mapping. Fourth, the statistical analyses were exploratory. Multiple pairwise comparisons were performed, P-values were interpreted descriptively, and odds ratios or confidence intervals may be unstable for sparse feature pairs. Pearson correlation coefficients for binary variables are also influenced by marginal prevalence. Fifth, k-means clustering grouped reports according to overall feature similarity rather than strict clinical diagnosis; therefore, clusters should be interpreted as exploratory phenotypic patterns, not validated disease subtypes. Finally, artificial intelligence-assisted extraction may have missed or misclassified information despite human verification and requires independent validation in curated datasets.
Suggestions for future research
Future studies should validate these exploratory findings using larger and more systematically curated datasets. Searches should be expanded beyond PubMed and PubMed Central to include additional bibliographic databases and regional literature sources, such as KoreaMed. Including non–free full-text reports may reduce selection bias and improve representativeness.
Further research should also standardize data extraction for age, sex, exposure history, diagnostic method, eosinophil count, organ involvement, treatment, and clinical outcome. Age-specific analyses may be useful because ocular larva migrans and visceral larva migrans may differ by age group [
2]. Exposure-related variables, including geophagia, ingestion of raw animal liver, and regional dietary practices, should also be considered because such factors have been described in previous studies [
6-
11].
Future analyses should compare artificial intelligence-assisted extraction with independent manual extraction to quantify the sensitivity, specificity, and error patterns of the workflow. Prospective clinical datasets or registry-based studies would be needed to determine whether the observed phenotypic patterns can support diagnosis, risk stratification, or clinical decision-making.
Conclusion
This Antigravity-assisted systematic scoping review identified exploratory co-occurrence, association, correlation, and clustering patterns among clinical manifestations reported in human toxocariasis case reports. The findings suggest relative separation between ocular and visceral phenotypes, frequent alignment of eosinophilia with systemic manifestations, and a multisystemic pattern among neurotoxocariasis-related reports. However, the results should be interpreted as hypothesis-generating rather than diagnostic or practice-guiding evidence. Artificial intelligence-assisted approaches may support data extraction and pattern recognition in scoping reviews, but human verification and validation against independently curated clinical datasets are required before clinical application.
-
Authors’ contribution
All work was completed by Eun Hee Ha.
-
Conflict of interest
The commercial program mentioned in this study is discussed for informational purposes and not for promotion. No other potential conflicts of interest relevant to this article were reported.
-
Funding
This work was supported by a student research grant from Hallym University College of Medicine (HLMC 2025-12-1). The funder had no role in study design, data collection and analysis, or manuscript preparation.
-
Data availability
Data files are available from Harvard Dataverse: https://doi.org/10.7910/DVN/33GBYE
Dataset 1. Data from the final 139 toxocariasis articles used for analysis.
-
Acknowledgments
None.
Supplementary materials
Supplement 1. Table of toxocariasis case reports indexed in the NCBI PubMed database (2005–2025) containing the following categories: PMID, title, patient age, sex, chief complaint, associated symptoms, eosinophil count, final diagnosis, raw abstract, organ involvement, symptoms (MeSH), and inclusion status.
Supplement 2. Elbow method and silhouette score cluster-validation metrics supporting the selection of k=4 as the optimal number of phenotypic clusters for the k-means analysis.
Supplement 3. Python code used for the data analysis in this study. All figures and Markdown files were generated using Antigravity.
Supplement 4. The underlying 2×2 contingency tables detailing the observed absolute cell counts (mutual presence, singular presence, and mutual absence) for all pairwise combinations of the analyzed toxocariasis-related clinical features.
Fig. 1.Flow diagram of the case-report selection process for data analysis, reported according to the Preferred Reporting Items for Systematic Reviews and Meta-Analyses Extension for Scoping Reviews guideline.
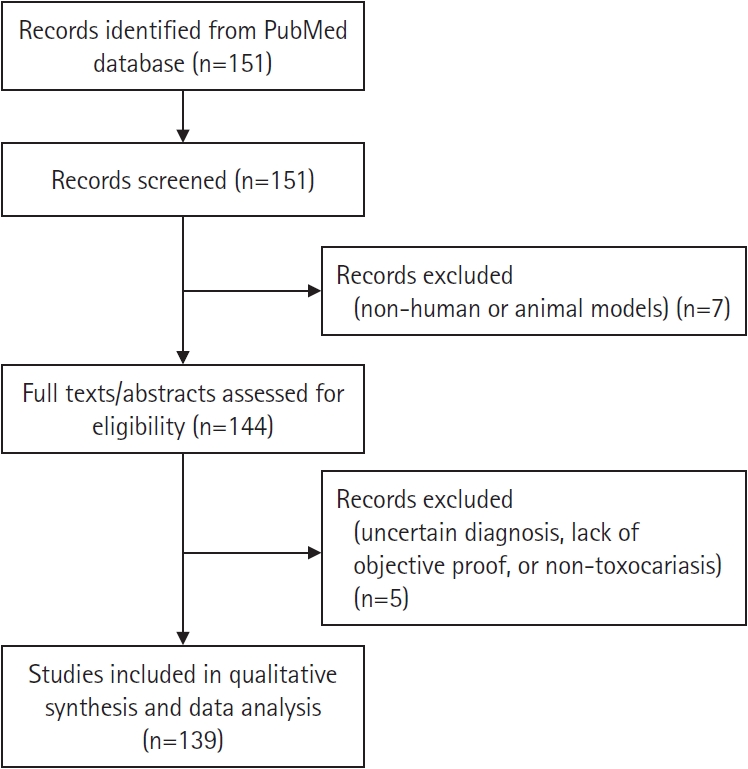
Fig. 2.Heatmap of co-occurrence counts for toxocariasis-associated clinical features.
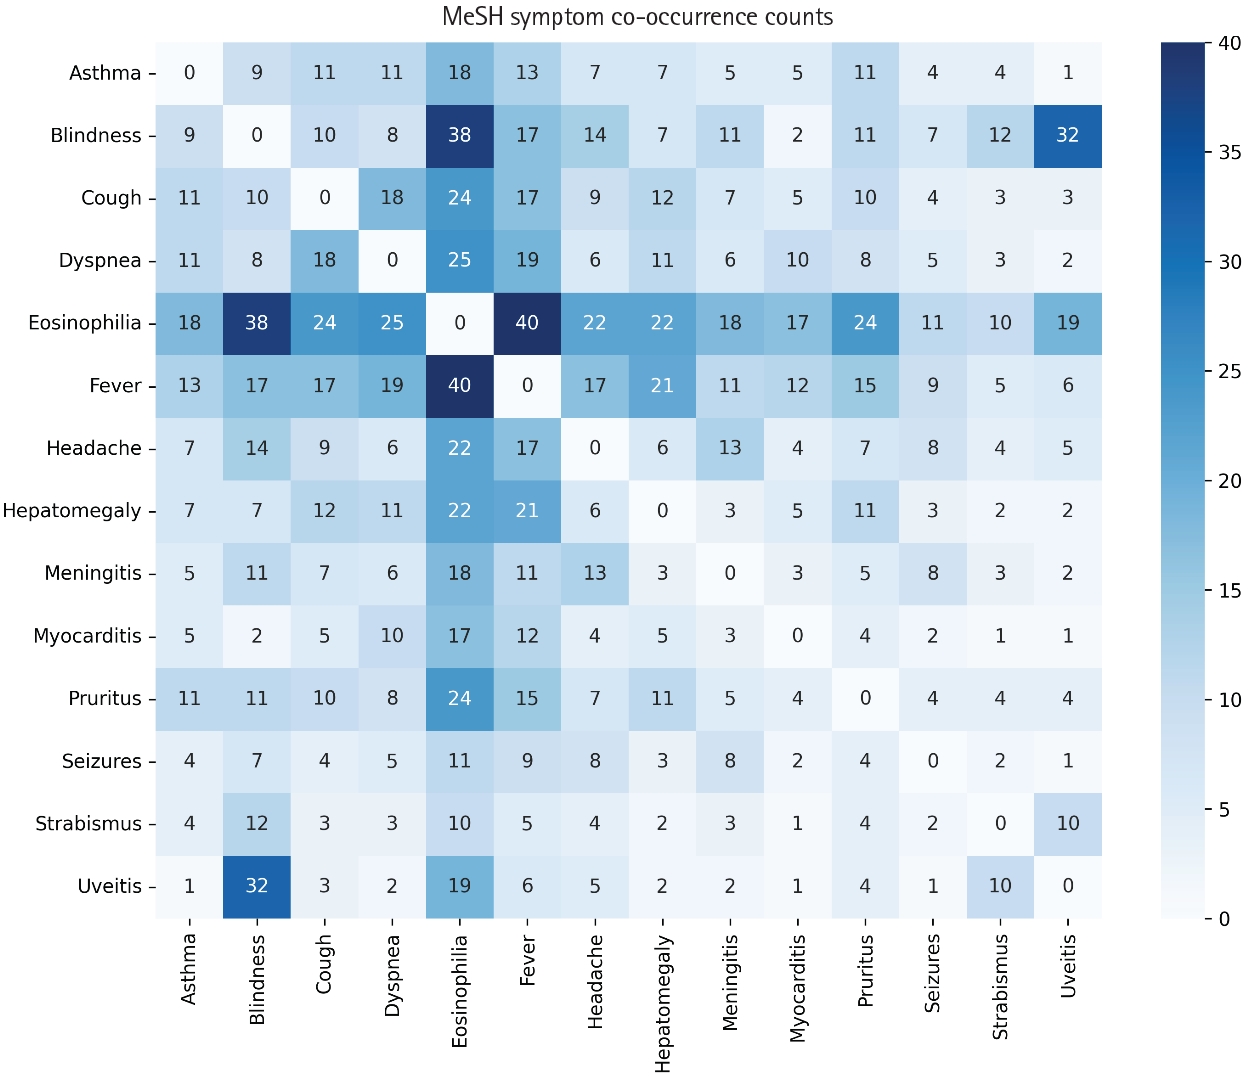
Fig. 3.Heatmap of −log10-transformed P-values for associations between toxocariasis-associated symptoms and features, calculated using Fisher’s exact test.
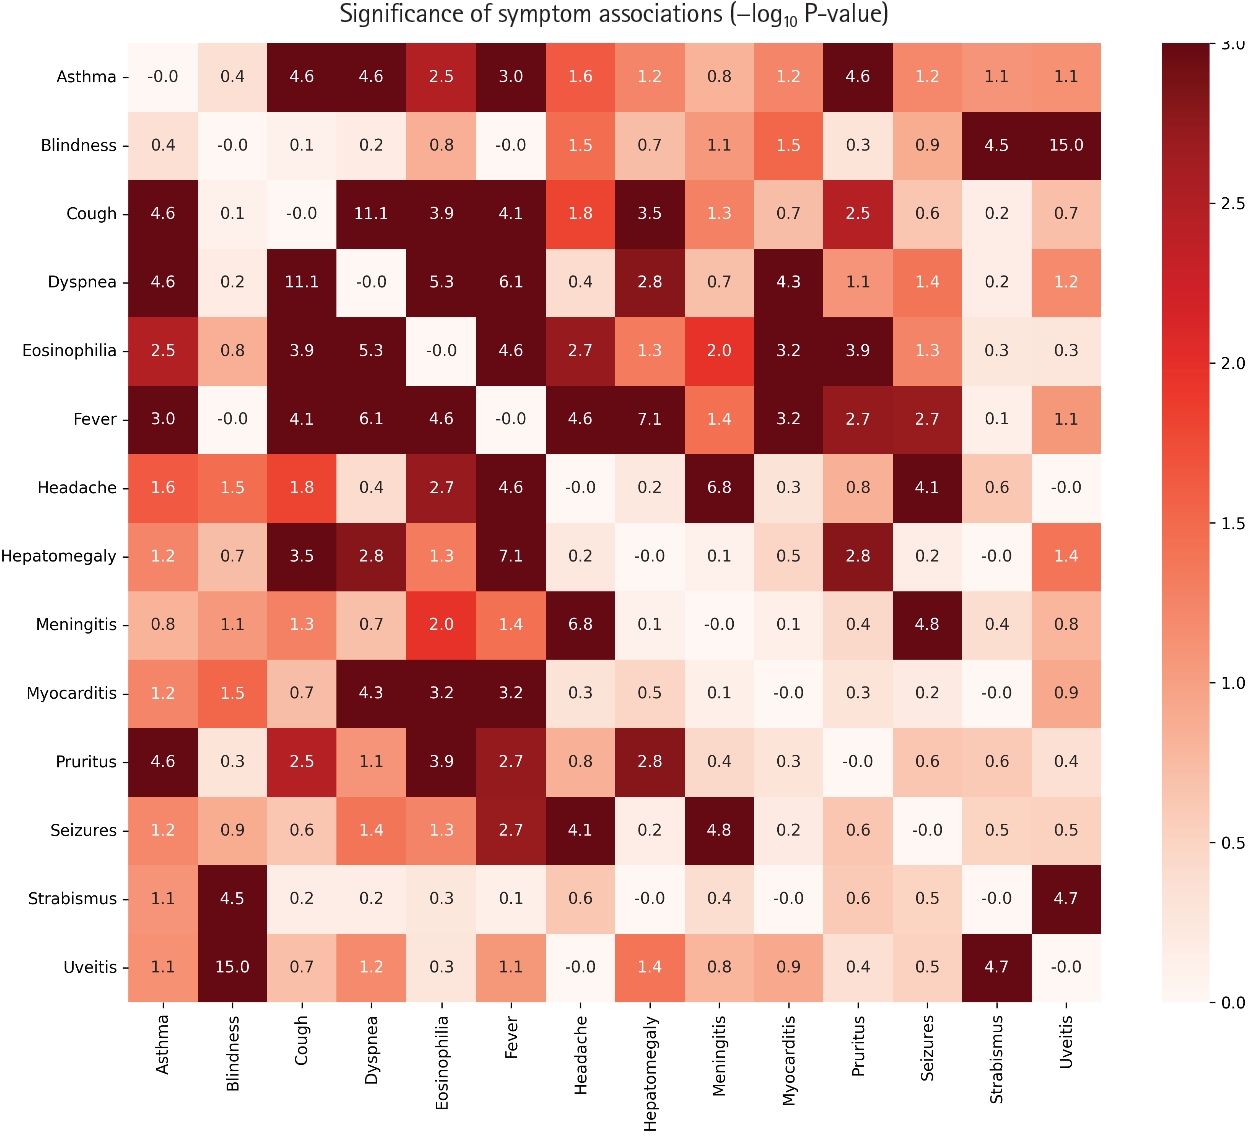
Fig. 4.Heatmap of Pearson correlation coefficients, equivalent to phi coefficients for binary clinical features, between toxocariasis-associated symptoms and organ-involvement variables.
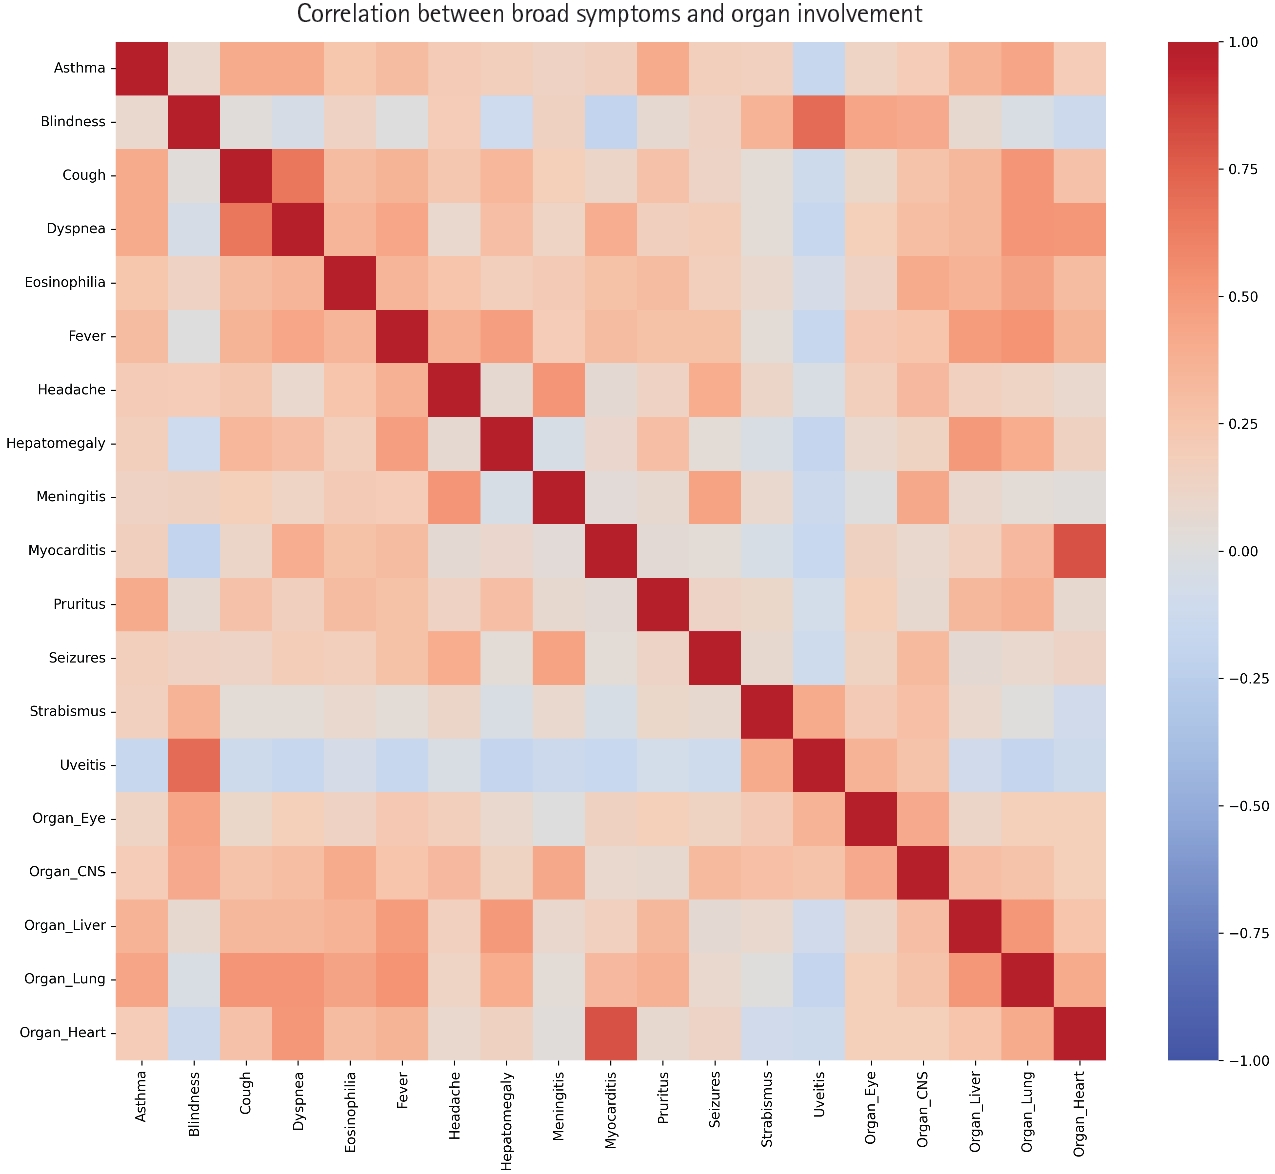
Table 1.Co-occurrence counts, ORs, 95% CIs, and Fisher’s exact test results for pairwise associations between toxocariasis-related clinical features
|
Feature 1 |
Feature 2 |
Co-occurrence count |
OR (95% exact CI) |
P-value |
Interpretation |
|
Eosinophilia |
Fever |
40 |
7.04 (2.44–24.56) |
<0.0001 |
Positive |
|
Blindness |
Uveitis |
32 |
Inf (31.00–Inf) |
<0.0001 |
Positive |
|
Dyspnea |
Eosinophilia |
25 |
Inf (4.41–Inf) |
<0.0001 |
Positive |
|
Cough |
Eosinophilia |
24 |
17.45 (2.62–732.42) |
0.0001 |
Positive |
|
Eosinophilia |
Pruritus |
24 |
17.45 (2.62–732.42) |
0.0001 |
Positive |
|
Eosinophilia |
Headache |
22 |
7.60 (1.71–69.05) |
0.0019 |
Positive |
|
Fever |
Hepatomegaly |
21 |
12.83 (4.30–42.38) |
<0.0001 |
Positive |
|
Dyspnea |
Fever |
19 |
10.72 (3.57–35.58) |
<0.0001 |
Positive |
|
Asthma |
Eosinophilia |
18 |
12.00 (1.76–510.18) |
0.0034 |
Positive |
|
Cough |
Dyspnea |
18 |
39.31 (10.84–148.27) |
<0.0001 |
Positive |
|
Cough |
Fever |
17 |
6.53 (2.33–19.19) |
<0.0001 |
Positive |
|
Eosinophilia |
Myocarditis |
17 |
Inf (2.59–Inf) |
0.0006 |
Positive |
|
Fever |
Headache |
17 |
7.55 (2.60–23.46) |
<0.0001 |
Positive |
|
Fever |
Pruritus |
15 |
4.20 (1.55–11.57) |
0.0019 |
Positive |
|
Asthma |
Fever |
13 |
5.96 (1.89–20.51) |
0.0009 |
Positive |
|
Headache |
Meningitis |
13 |
18.23 (5.28–64.50) |
<0.0001 |
Positive |
|
Blindness |
Strabismus |
12 |
25.80 (3.52–1,115.25) |
<0.0001 |
Positive |
|
Cough |
Hepatomegaly |
12 |
6.09 (2.08–17.48) |
0.0003 |
Positive |
|
Fever |
Myocarditis |
12 |
6.47 (1.91–24.92) |
0.0007 |
Positive |
|
Asthma |
Cough |
11 |
10.41 (3.13–34.77) |
<0.0001 |
Positive |
|
Asthma |
Dyspnea |
11 |
10.41 (3.13–34.77) |
<0.0001 |
Positive |
|
Asthma |
Pruritus |
11 |
10.41 (3.13–34.77) |
<0.0001 |
Positive |
|
Dyspnea |
Hepatomegaly |
11 |
4.81 (1.64–13.69) |
0.0016 |
Positive |
|
Hepatomegaly |
Pruritus |
11 |
4.81 (1.64–13.69) |
0.0016 |
Positive |
|
Cough |
Pruritus |
10 |
4.40 (1.46–12.73) |
0.0035 |
Positive |
|
Dyspnea |
Myocarditis |
10 |
10.19 (2.92–36.00) |
<0.0001 |
Positive |
|
Strabismus |
Uveitis |
10 |
15.76 (3.57–93.60) |
<0.0001 |
Positive |
|
Fever |
Seizures |
9 |
7.58 (1.74–45.25) |
0.0020 |
Positive |
|
Headache |
Seizures |
8 |
13.88 (3.18–68.27) |
<0.0001 |
Positive |
|
Meningitis |
Seizures |
8 |
19.17 (4.21–96.45) |
<0.0001 |
Positive |
|
Eosinophilia |
Hepatomegaly |
22 |
2.85 (0.95–10.27) |
0.0462 |
Positive |
|
Eosinophilia |
Meningitis |
18 |
5.88 (1.30–54.03) |
0.0108 |
Positive |
|
Blindness |
Headache |
14 |
2.84 (1.05–7.81) |
0.0351 |
Positive |
|
Fever |
Meningitis |
11 |
3.06 (1.04–9.10) |
0.0361 |
Positive |
|
Cough |
Headache |
9 |
3.71 (1.21–10.87) |
0.0156 |
Positive |
|
Asthma |
Headache |
7 |
3.53 (1.02–11.36) |
0.0234 |
Positive |
|
Dyspnea |
Seizures |
5 |
3.82 (0.86–15.46) |
0.0411 |
Positive |
|
Blindness |
Myocarditis |
2 |
0.19 (0.02–0.89) |
0.0297 |
Negative |
|
Hepatomegaly |
Uveitis |
2 |
0.22 (0.02–0.98) |
0.0400 |
Negative |
Table 2.Descriptive tiers of nominal pairwise associations between toxocariasis-related clinical features
|
Feature 1 |
Feature 2 |
P-value |
Nominal P-value tier |
|
Asthma |
Cough |
<0.0001 |
Nominal (P<0.01) |
|
Asthma |
Dyspnea |
<0.0001 |
Nominal (P<0.01) |
|
Asthma |
Eosinophilia |
0.0034 |
Nominal (P<0.01) |
|
Asthma |
Fever |
0.0009 |
Nominal (P<0.01) |
|
Asthma |
Headache |
0.0234 |
Nominal (0.01<P≤0.05) |
|
Asthma |
Pruritus |
<0.0001 |
Nominal (P<0.01) |
|
Blindness |
Headache |
0.0351 |
Nominal (0.01<P≤0.05) |
|
Blindness |
Myocarditis |
0.0297 |
Nominal (0.01<P≤0.05) |
|
Blindness |
Strabismus |
<0.0001 |
Nominal (P<0.01) |
|
Blindness |
Uveitis |
<0.0001 |
Nominal (P<0.01) |
|
Cough |
Dyspnea |
<0.0001 |
Nominal (P<0.01) |
|
Cough |
Eosinophilia |
0.0001 |
Nominal (P<0.01) |
|
Cough |
Fever |
0.0001 |
Nominal (P<0.01) |
|
Cough |
Headache |
0.0156 |
Nominal (0.01<P≤0.05) |
|
Cough |
Hepatomegaly |
0.0003 |
Nominal (P<0.01) |
|
Cough |
Pruritus |
0.0035 |
Nominal (P<0.01) |
|
Dyspnea |
Eosinophilia |
<0.0001 |
Nominal (P<0.01) |
|
Dyspnea |
Fever |
<0.0001 |
Nominal (P<0.01) |
|
Dyspnea |
Hepatomegaly |
0.0016 |
Nominal (P<0.01) |
|
Dyspnea |
Myocarditis |
0.0001 |
Nominal (P<0.01) |
|
Dyspnea |
Seizures |
0.0411 |
Nominal (0.01<P≤0.05) |
|
Eosinophilia |
Fever |
<0.0001 |
Nominal (P<0.01) |
|
Eosinophilia |
Headache |
0.0019 |
Nominal (P<0.01) |
|
Eosinophilia |
Hepatomegaly |
0.0462 |
Nominal (0.01<P≤0.05) |
|
Eosinophilia |
Meningitis |
0.0108 |
Nominal (0.01<P≤0.05) |
|
Eosinophilia |
Myocarditis |
0.0006 |
Nominal (P<0.01) |
|
Eosinophilia |
Pruritus |
0.0001 |
Nominal (P<0.01) |
|
Fever |
Headache |
<0.0001 |
Nominal (P<0.01) |
|
Fever |
Hepatomegaly |
<0.0001 |
Nominal (P<0.01) |
|
Fever |
Meningitis |
0.0361 |
Nominal (0.01<P≤0.05) |
|
Fever |
Myocarditis |
0.0007 |
Nominal (P<0.01) |
|
Fever |
Pruritus |
0.0019 |
Nominal (P<0.01) |
|
Fever |
Seizures |
0.0020 |
Nominal (P<0.01) |
|
Headache |
Meningitis |
<0.0001 |
Nominal (P<0.01) |
|
Headache |
Seizures |
0.0001 |
Nominal (P<0.01) |
|
Hepatomegaly |
Pruritus |
0.0016 |
Nominal (P<0.01) |
|
Hepatomegaly |
Uveitis |
0.0400 |
Nominal (0.01<P≤0.05) |
|
Meningitis |
Seizures |
<0.0001 |
Nominal (P<0.01) |
|
Strabismus |
Uveitis |
<0.0001 |
Nominal (P<0.01) |
Table 3.Summary of the 4 phenotypic clusters identified by k-means clustering
|
Cluster |
Clinical label |
No. of cases |
Distinguishing symptoms or features (prevalence >15%) |
Descriptive feature profile |
|
1 |
Subclinical disease |
62 |
Eosinophilia (48.4%) |
Characterized by mild, atypical, or incompletely documented presentations. |
|
2 |
Ocular larva migrans |
29 |
Blindness (100.0%), uveitis (100.0%), eosinophilia (55.2%), strabismus (31.0%) |
Characterized by concentrated ocular inflammation and subsequent severe visual impairment. |
|
3 |
Visceral larva migrans |
30 |
Fever (93.3%), eosinophilia (86.7%), hepatomegaly (63.3%), dyspnea (46.7%), cough (40.0%), asthma (33.3%), pruritus (33.3%), myocarditis (33.3%), headache (16.7%) |
Distinguished by a pronounced systemic inflammatory presentation, including fever, together with major liver and cardiopulmonary involvement. |
|
4 |
Neurotoxocariasis/multisystemic disease |
18 |
Eosinophilia (100.0%), blindness (83.3%), meningitis (77.8%), headache (77.8%), fever (72.2%), seizures (55.6%), cough (50.0%), dyspnea (44.4%), asthma (38.9%), pruritus (33.3%), myocarditis (16.7%), hepatomegaly (16.7%), strabismus (16.7%) |
Distinguished by central nervous system involvement accompanied by multisystemic manifestations. Ocular features were also frequent, including blindness in 83.3% of cases. |
References
- 1. Stensvold CR, Nielsen HV, Petersen E. Toxocariasis. Ugeskr Laeger 2011;173:186-189.
- 2. Yoshida A, Hombu A, Wang Z, Maruyama H. Larva migrans syndrome caused by Toxocara and Ascaris roundworm infections in Japanese patients. Eur J Clin Microbiol Infect Dis 2016;35:1521-1529. https://doi.org/10.1007/s10096-016-2693-x
- 3. Minamii T, Nishioka H. Case report: Toxocariasis manifesting as eosinophilic pleural effusion. Am J Trop Med Hyg 2024;110:687-690. https://doi.org/10.4269/ajtmh.23-0343
- 4. Paul M, Stefaniak J, Twardosz-Pawlik H, Pecold K. The co-occurrence of Toxocara ocular and visceral larva migrans syndrome: a case series. Cases J 2009;2:6881. https://doi.org/10.1186/1757-1626-2-6881
- 5. Choi KD, Choi JH, Choi SY, Jung JH. Toxocara optic neuropathy: clinical features and ocular findings. Int J Ophthalmol 2018;11:520-523. https://doi.org/10.18240/ijo.2018.03.26
- 6. Huynh TM, Tran KQ, Dinh TH, Vo MM, Pham TQ, Vo TD. Atypical Toxocara canis-induced hepatic visceral larva migrans: diagnostic challenges and literature review. Korean J Gastroenterol 2024;83:247-252. https://doi.org/10.4166/kjg.2024.051
- 7. Pieroni F, Massei F, Micheletti MV, Luti L, De Marco E, Ludovisi A, Casazza G, Bruschi F. Toxocariasis in a child with autism spectrum disorder. Int J Environ Res Public Health 2021;18:283. https://doi.org/10.3390/ijerph18010283
- 8. Sayas I, Álvarez P, Pajuelo R, Luque W, Tassara C. Atypical presentation of infant toxocariasis: about a case. Rev Chilena Infectol 2021;38:698-701. https://doi.org/10.4067/s0716-10182021000500698
- 9. Üblagger D, Auer H, Bezakova M, Kirchlechner V. Toxocarosis in a patient with autism spectrum disorder presenting with severe hypereosinophilia and acute respiratory distress: a case report. Parasitol Res 2024;123:99. https://doi.org/10.1007/s00436-024-08119-y
- 10. Noh Y, Hong ST, Yun JY, Park HK, Oh JH, Kim YE, Jeon BS. Meningitis by Toxocara canis after ingestion of raw ostrich liver. J Korean Med Sci 2012;27:1105-1108. https://doi.org/10.3346/jkms.2012.27.9.1105
- 11. Yoshikawa M, Ouji Y, Nishiofuku M, Moriya K, Kasahara K, Mikasa KI, Mizuno Y, Nakamura T, Ogawa S, Ishizaka S, Akao N. Visceral toxocariasis from regular consumption of raw cow liver. Intern Med 2008;47:1289-1290. https://doi.org/10.2169/internalmedicine.47.1191