Abstract
-
Purpose
This study aimed to assess the spatiotemporal associations between air pollution and emergency room visits for cardiovascular and cerebrovascular diseases in South Korea using a graph autoencoder (GAE). A multivariate graph-based approach was used to uncover seasonal and regional variations in pollutant–disease relationships.
-
Methods
We collected monthly data from 2022 to 2023, including concentrations of 6 air pollutants (SO2, NO2, O3, CO, PM10, and PM2.5) and emergency room visits for 4 disease types: cardiac arrest, myocardial infarction, ischemic stroke, and hemorrhagic stroke. Pearson correlation coefficients were used to construct adjacency matrices, which, along with normalized feature matrices, were used as inputs to the GAE. The model was trained separately for each month and region to estimate the strength of pollutant–disease associations.
-
Results
The pollutant–disease network structures exhibited clear seasonal variations. In winter, strong associations were observed between O3, NO2, and all disease outcomes. In spring, PM2.5 and PM10 were strongly linked to cardiac and stroke-related visits. These connections weakened during summer but became more pronounced in autumn, especially for NO2 and cardiac arrest. Urban areas displayed denser and stronger associations than non-urban areas.
-
Conclusion
Our findings underscore the necessity for season- and region-specific air quality management strategies. In winter, focused control of O3 and NO2 is needed in urban areas, while in spring, PM mitigation is required in urban and selected rural regions. Autumn NO2 control may be especially beneficial in non-urban areas. Spatiotemporally tailored interventions could reduce the burden of air pollution-related emergency room visits.
-
Keywords: Air pollution; Cardiovascular diseases; Environmental pollutants; Epidemiology; Ischemic stroke; Republic of Korea
Introduction
Background
Cardiovascular and cerebrovascular diseases are among the leading causes of morbidity and mortality worldwide. In South Korea, their burden is steadily increasing due to rapid urbanization, population aging, and lifestyle changes [
1]. Traditionally, risk factors such as hypertension, diabetes, dyslipidemia, smoking, and physical inactivity have been the main focus of disease prevention and management efforts. However, in recent years, environmental influences, particularly air pollution, have attracted increasing attention as significant and modifiable contributors to disease onset and progression [
2].
Numerous epidemiological studies have reported that both short- and long-term exposure to ambient pollutants—including fine particulate matter (PM
2.5 and PM
10), nitrogen dioxide (NO
2), and sulfur dioxide (SO
2)—is associated with elevated risks of myocardial infarction (MI), ischemic stroke (IS), and cardiac arrest (CA) [
2-
5]. For instance, time-series analyses and cohort studies conducted in Korea and globally have demonstrated significant associations between pollutant concentration spikes and increased hospital admissions or mortality due to cardiovascular events [
6-
8]. Nevertheless, these studies often employ traditional statistical methods, which primarily focus on single-variable relationships or use linear models to estimate risk ratios or odds ratios [
6-
8]. While such approaches provide valuable insights into individual pollutant effects, they have limitations in addressing the complex, nonlinear, and multivariate nature of real-world environmental exposures and disease dynamics [
9].
Moreover, both air pollution and health outcomes show pronounced spatiotemporal variation. Pollutant concentrations fluctuate seasonally due to meteorological and atmospheric factors, and regionally owing to differences in industrial activity, traffic density, and urban infrastructure. At the same time, the health impacts of pollution may vary depending on regional healthcare access, population vulnerability, and baseline disease prevalence [
10-
12]. These multifaceted interactions prompt important questions: How do pollutant–disease relationships vary across seasons and geographic regions? Which pollutants are most strongly associated with cardiovascular or cerebrovascular diseases in specific contexts?
To address these questions, more advanced analytical tools are needed. Recent developments in artificial intelligence and deep learning, especially within the field of graph neural networks, offer new possibilities for modeling complex relationships between interconnected variables. Among these, the graph autoencoder (GAE) has shown promise in learning hidden structures and association strengths from multivariate graph data [
13].
In this study, we applied a GAE framework to nationwide data from Korea spanning 2022 to 2023, integrating monthly air pollution measurements with emergency room visit data for 4 major cardiovascular and cerebrovascular disease outcomes: CA, MI, IS, and hemorrhagic stroke (HS). By constructing graphs based on correlation structures and training GAE models across different time points and regions, we aimed to uncover latent patterns in the pollutant–disease network. The objective of this study is to provide empirical evidence that can inform season- and region-specific public health strategies, enhance risk prediction, and support environmental health policy initiatives to reduce acute disease events triggered by air pollution exposure.
Methods
Ethics statement
This study used publicly available, de-identified secondary data obtained from national databases; therefore, it did not involve direct human participation or identifiable personal information. As a result, institutional review board approval and informed consent were not required under local regulations.
Study design
This research is a nationwide ecological analysis. The study is described in accordance with the STROBE (Strengthening the Reporting of Observational Studies in Epidemiology) statement, available at
https://www.strobe-statement.org/.
This study explored the association between air pollutant concentrations and emergency room visits for cardiovascular and cerebrovascular diseases in Korea from January 2022 to December 2023 (
Supplement 1). To address the complex, nonlinear, and multivariate nature of environmental health data, a graph-based machine learning model (GAE) was applied to identify and visualize seasonal and regional association patterns.
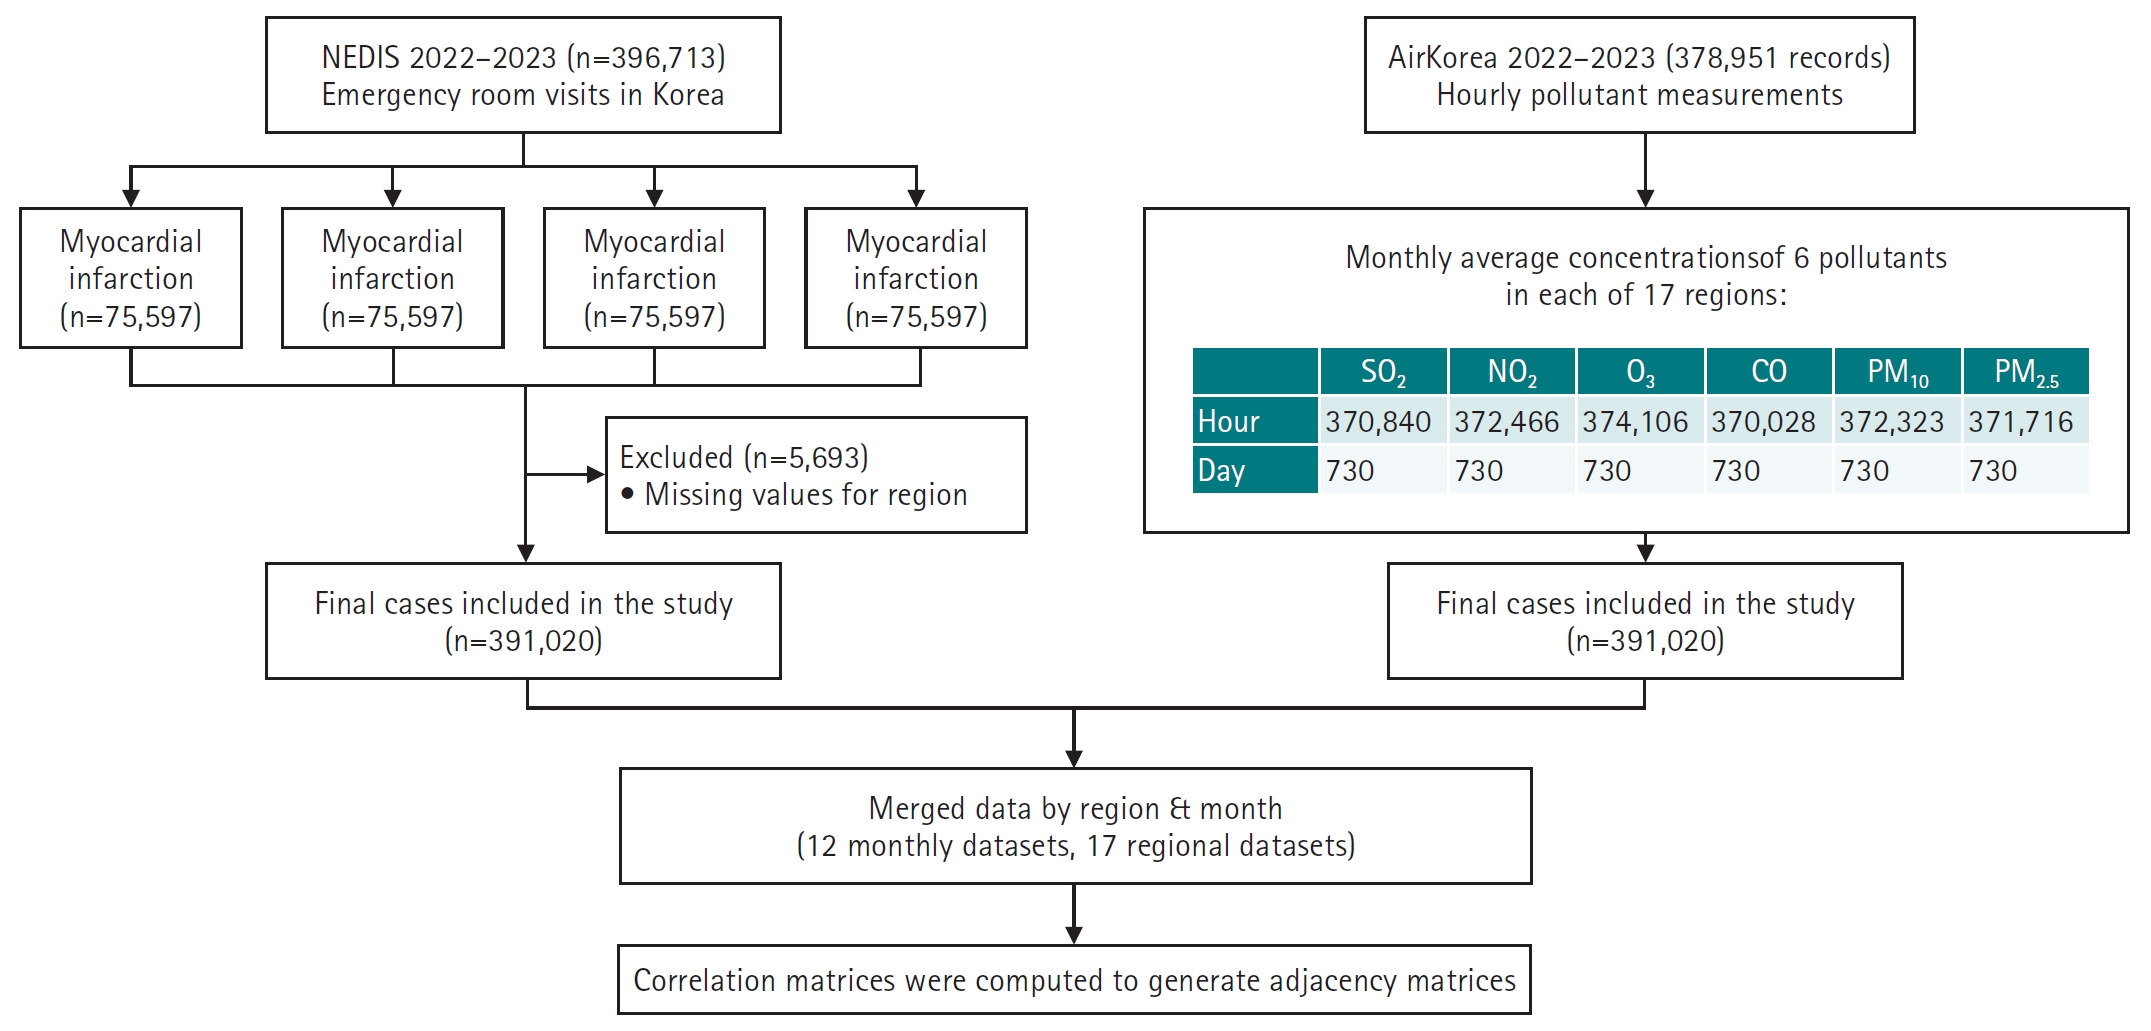
A total of 378,951 air pollution records and 396,713 emergency room visit cases were initially collected. After excluding 5,693 cases with missing or ambiguous regional information, the final analytic sample included 391,020 cases (
Fig. 1,
Supplement 1).
Exposure variables included 6 pollutants: SO2, NO2, ozone (O3), carbon monoxide (CO), particulate matter ≤10 μm (PM10), and particulate matter ≤2.5 μm (PM2.5). Outcome variables comprised 4 major disease categories: CA, MI, IS, and HS.
Data sources
Two national datasets were utilized to examine the relationship between air pollution and emergency room visits for cardiovascular and cerebrovascular diseases. Air pollution data were obtained from the National Air Pollution Monitoring Network (AirKorea;
https://www.airkorea.or.kr/web/pastSearch?pMENU_NO=123) and included hourly measurements of pollutants (
Dataset 1). Disease data were sourced from the National Emergency Department Information System (NEDIS;
https://www.e-gen.or.kr/nemc/statistics_annual_report.do?brdclscd=02), managed by the Ministry of Health and Welfare (
Dataset 2). These datasets provided monthly counts of emergency room visits for the 4 major disease categories, recorded across 17 administrative regions.
Several preprocessing steps were conducted to enable integrated spatiotemporal analysis. First, hourly air pollution data were aggregated to monthly average concentrations for each of the 17 administrative regions. Monthly aggregation was adopted because emergency room visit counts from NEDIS were only available at a monthly frequency and at the provincial (si-do) level; pollutant measurements from individual monitoring stations were likewise aggregated to ensure consistency. Next, pollutant and disease datasets were merged by matching month and region, resulting in 2 structured input types: (1) time-based datasets for each 12-month period, used to explore seasonal variation, and (2) region-based datasets covering 17 provinces, used to assess spatial heterogeneity. Finally, all variables were normalized to a 0–1 scale using Min-Max scaling to standardize input values and facilitate stable model training (
Fig 1,
Supplement 2).
The integrated dataset was transformed into graph structures for input into the GAE model (
Supplements 2,
3). Each of the 10 key variables—comprising the 6 pollutants and 4 disease categories—was represented as a node in the graph. A Pearson correlation matrix was calculated to quantify the relationships between nodes. An edge was created between 2 nodes only if the absolute value of the Pearson correlation coefficient (|ρᵢⱼ|) was greater than or equal to 0.4, resulting in a sparse adjacency matrix (A). The corresponding node feature matrix (X) was defined such that n=10 (number of nodes), and d represented the number of observations: 12 for time-series (monthly) analyses and 17 for regional (spatial) analyses.
As an ecological study, this analysis is subject to the risk of ecological fallacy, whereby associations observed at the population level may not apply to individuals. Potential confounding factors, such as meteorological conditions, socioeconomic status, and comorbidities, were not available in the dataset and could influence the observed associations.
Study size
All eligible records from national administrative databases for the defined period were analyzed; therefore, no sample size calculation was performed.
Statistical methods
The GAE model was implemented using the PyTorch Geometric library. The model architecture included an encoder with 2 graph convolutional layers (GCNConv) to compute node embeddings (Z), and a decoder that estimated edge probabilities between nodes by calculating the inner product of the embeddings, followed by a sigmoid activation function (σ). The loss function was defined as the binary cross-entropy between the original adjacency matrix (A) and the reconstructed matrix (Â). Model training was conducted for 100 epochs using the Adam optimizer with a learning rate of 0.01 (
Supplements 2,
3). The resulting embedding vectors (Z) were visualized in 2-dimensional space to facilitate interpretation. Node positions were fixed based on the learned embeddings, and edge thickness was adjusted according to the predicted edge strength, visually reflecting the relative magnitude of pollutant–disease associations.
Two complementary analytical strategies were employed to explore the spatiotemporal dynamics of the pollutant–disease relationships. First, for the seasonal analysis, GAE models were trained individually for each month from January to December in both 2022 and 2023, allowing assessment of temporal variability. Second, for the regional analysis, the dataset was subdivided according to the 17 administrative regions, and separate GAE models were developed to examine spatial heterogeneity.
Additionally, a lag analysis was performed using pollutant concentrations from the previous month (t–1) to predict emergency room visits in the current month (t). The resulting graphs were exported as PNG images for visual inspection. In addition, the predicted edge strengths generated by the GAE and the corresponding Pearson correlation coefficients were compiled into Excel files (Microsoft Corp.) to enable comparative and supplementary quantitative analysis (
Supplement 3).
Results
GAE models were applied to spatiotemporal datasets of air pollutants and emergency room visits for cardiovascular and cerebrovascular diseases across 17 administrative regions in Korea, spanning January 2022 to December 2023. The analysis revealed pronounced seasonal patterns in pollutant–disease associations, as well as distinct structural differences between urban and non-urban regions.
Seasonal variations
Using monthly GAE models, we constructed pollutant–disease networks to track how associations changed across seasons in 2022 (
Fig. 2A–
D,
Supplements 4,
5). Each network visualizes the structural complexity and strength of connections between 6 major air pollutants—SO
2, NO
2, O
3, CO, PM
10, and PM
2.5—and 4 emergency room diagnoses: MI, IS, HS, and CA.
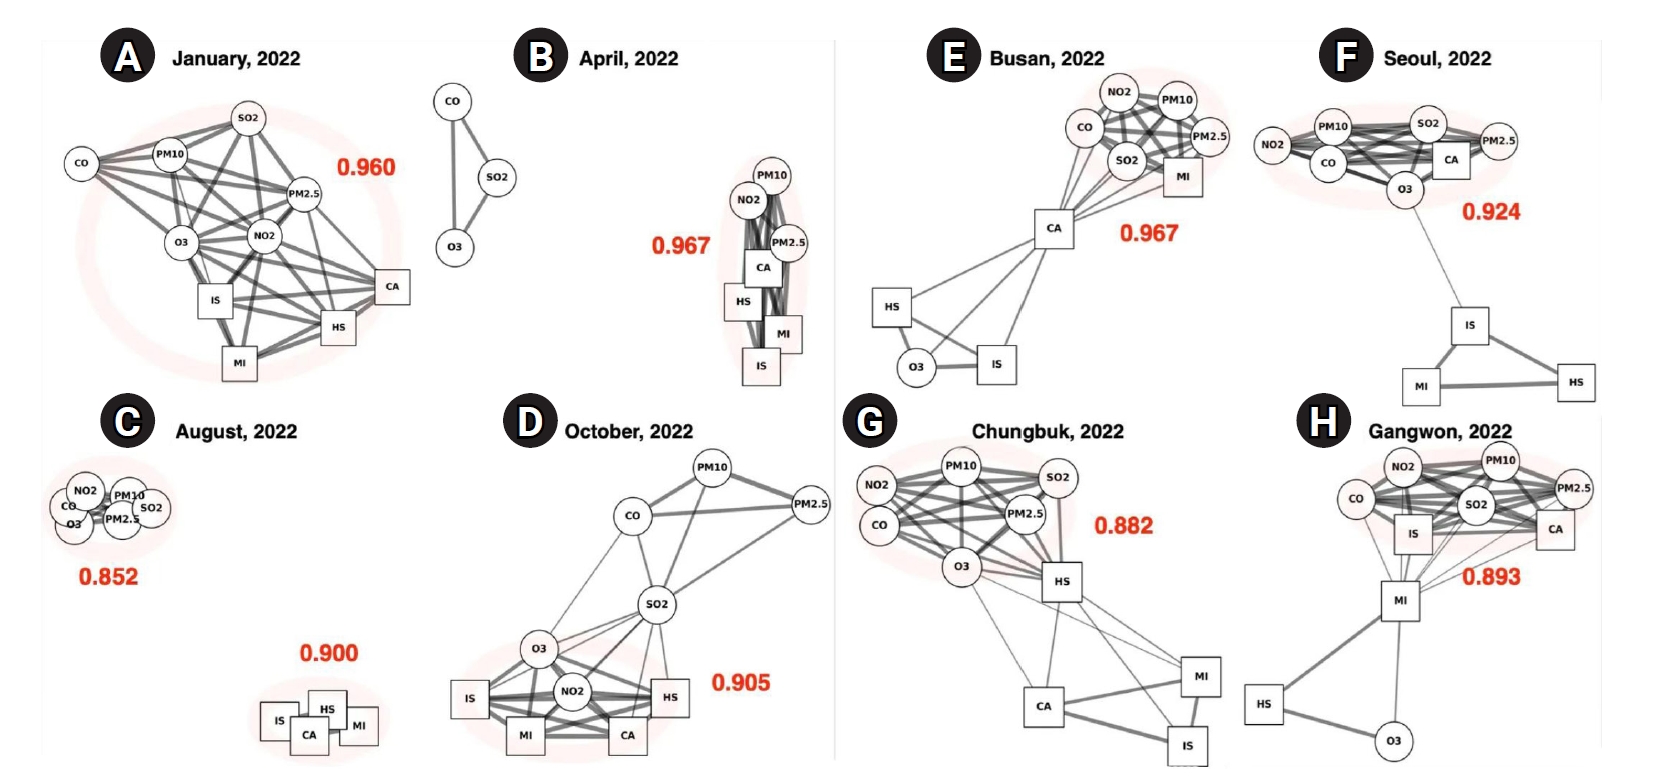
In January, the network displayed the densest connections of any month, with a high mean edge strength of 0.960 (
Fig. 2A). Most nodes were highly interconnected, and NO
2 and O
3 emerged as central hubs, robustly linked not only to each disease outcome but also to the other pollutants, including SO
2, PM
10, PM
2.5, and CO. These widespread linkages suggest that exposure to multiple pollutants during winter imposes a cumulative burden on cardiovascular and cerebrovascular health. Notably, MI, IS, and CA all showed concurrent associations with nearly every pollutant, highlighting the particular vulnerability of these acute conditions to wintertime pollution.
By April, although the network remained complex—with the highest mean edge strength of the year at 0.967—the dominant pattern shifted (
Fig. 2B). A highly integrated subnetwork formed among PM
2.5, PM
10, NO
2, and the 4 disease nodes, indicating that particulate matter and NO
2 were the primary contributors to emergency visits in spring. In contrast to the winter network, where O
3 was central, ozone became peripheral in spring, and both CO and SO
2 disconnected from the disease cluster. This reorganization points to seasonal specificity in pollutant effects. In particular, the edge between PM
10 and CA, as well as between PM
2.5 and MI, was notably strengthened.
In August, the network showed a distinct bifurcation: pollutant nodes (NO
2, PM
10, PM
2.5, SO
2, CO, O
3) formed a tightly interconnected group, while disease nodes (MI, HS, IS, CA) clustered separately, with few or no direct links to pollutants (
Fig. 2C). This configuration yielded the lowest mean correlation of the year, at 0.852. The reduced connectivity likely reflects decreased pollutant concentrations and enhanced atmospheric dispersion in summer, contributing to a temporary attenuation of acute health risks. Nevertheless, the strong internal cohesion among pollutants suggests that environmental exposure remained a concern, even in the absence of immediate disease associations.
By October, network connectivity rebounded, with a mean edge value of 0.905. NO
2 and O
3 reemerged as central nodes and re-established links with all 4 disease outcomes (
Fig. 2D). In contrast to spring, CO and SO
2 were once again integrated into the disease–pollutant cluster, suggesting a broader pollutant profile influencing emergency room visits as temperatures cooled. A particularly dense connection between NO
2, MI, and CA was observed, closely resembling the winter pattern and indicating a resurgence of cardiovascular vulnerability. Notably, PM
2.5 and PM
10 were less prominent in autumn than in spring, suggesting that gaseous pollutants once again played a leading role in disease associations during the colder transition period.
Regional-level analysis was performed using individual GAE models for each of Korea’s 17 administrative regions, as shown in
Fig. 2E–
H and
Supplements 6 and
7. This approach enabled detailed comparisons of network structures between urban and non-urban areas, revealing clear differences in the complexity and strength of pollutant–disease associations.
Urban regions such as Busan and Seoul exhibited highly connected and densely structured networks. In Busan, the network had the highest regional correlation coefficient (0.967), with CA centrally positioned and strongly linked to several pollutants, including NO
2, SO
2, PM
10, and PM
2.5. MI also showed robust connections, particularly with fine particulate matter, suggesting that cardiovascular risk in this metropolitan area is influenced by a broad spectrum of air pollutants (
Fig. 2E). In Seoul, a similarly complex subnetwork formed among gaseous pollutants (NO
2, CO, O
3, SO
2), PMs, and CA. IS, MI, and HS were separated from this main cluster, while the remaining nodes interlinked to form an overall dense structure, with a correlation coefficient of 0.924 (
Fig. 2F). Non-urban areas presented a contrasting profile. In Chungbuk, the network was moderately sparse (0.882), with pollutant nodes densely interconnected but showing fewer links to disease nodes. HS had limited connections, while MI and IS remained more peripheral (
Fig. 2G). In Gangwon, the structure was slightly denser (0.893) than in Chungbuk but still showed some disconnection between certain diseases and pollutants (
Fig. 2H). MI emerged as a bridge between the pollutant cluster—especially SO
2 and NO
2—and other health outcomes, while O
3 and HS were more isolated. These findings indicate that non-metropolitan regions, while not devoid of pollutant–disease interactions, experience weaker or less complex exposures compared to urban centers, likely reflecting differences in emission sources, population density, and environmental conditions.
Supplements 8–
11 present lagged GAE networks in which pollutant concentrations from the previous month (t–1) are used to predict emergency room visits in the current month (t). The lagged networks exhibit seasonal patterns similar to those found in the contemporaneous analysis: in winter, strong NO
2–O
3 and disease node linkages persist, while in summer, overall network connectivity remains attenuated. These parallel findings confirm that the monthly co-occurrence patterns identified in the primary analysis are robust to a 1-month temporal shift.
Discussion
Key results
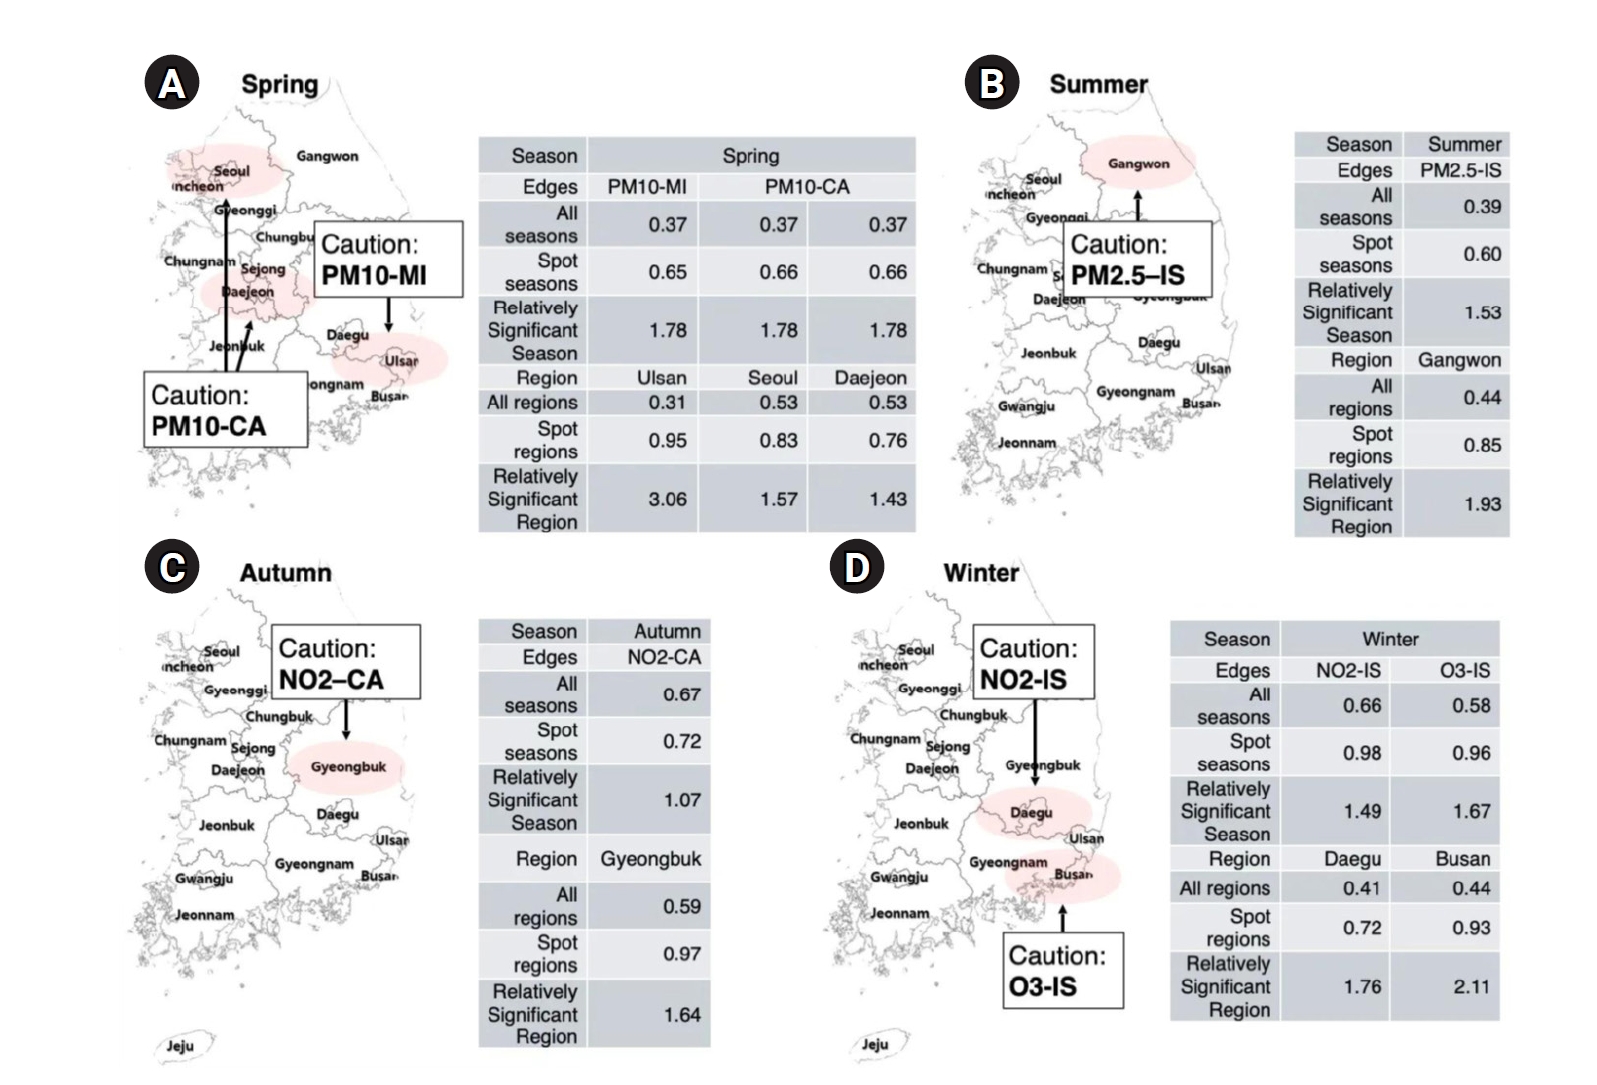
This study applied a GAE model to evaluate the spatiotemporal associations between air pollutants and emergency room visits for cardiovascular and cerebrovascular diseases across Korea during 2022–2023. The findings revealed pronounced seasonal and regional variations (
Fig. 3A–
D). Strong associations were observed in winter between NO
2/O
3 and IS, in spring between particulate matter (PM
10 and PM
2.5) and MI or CA, and in autumn between NO
2 and CA. Urban regions consistently displayed more complex pollutant–disease networks than non-urban areas, highlighting differential exposure and vulnerability [
14].
These seasonal shifts in network structure reflect both bulk concentration changes and mechanistic compositional differences. In winter, elevated NO
2 and O
3 levels—driven by increased residential heating emissions and atmospheric stagnation—contrast with higher PM mass in spring, attributable to dust storms and intensified outdoor activity [
15,
16]. Source-apportionment studies further indicate that secondary inorganic aerosols (sulfate, nitrate, ammonium) make up approximately 64% of PM
2.5 in winter (compared to a 49% annual average), with a sulfate-to-nitrate mass ratio of around 1.5:1. In spring (March–May), crustal dust contributions increase from 8% to 12%, and the combined sulfate plus nitrate fraction rises from 39% to 45% [
17,
18]. The attenuated associations in summer could be due to improved pollutant dispersion and increased indoor activities, such as staying in air-conditioned environments, which lower personal exposure; however, persistent risks in regions like Gangwon suggest localized vulnerabilities [
15,
19-
22].
The regional differences, particularly the denser connections in metropolitan centers, underscore health disparities resulting from urbanization [
23,
24]. These results fulfill the study’s objectives by identifying critical periods and locations for targeted air quality and health interventions. The GAE approach provided a robust framework for detecting nonlinear, multivariate relationships that conventional statistical models may miss [
25].
Given these spatiotemporal dynamics, our findings support the need for season-specific and region-specific public health strategies. In winter (
Fig. 3D), strict management of NO
2 and O
3—along with focused health monitoring of at-risk populations in major cities such as Busan, Daegu, and the Seoul Metropolitan Area—is essential [
26,
27]. In spring, effective control of particulate matter (PM
10 and PM
2.5) and improvements in indoor air quality in urban centers like Seoul, Daejeon, and Ulsan may help reduce emergency cardiovascular incidents [
28] (
Fig. 3A). In autumn, targeted NO
2 reduction strategies should be prioritized in non-metropolitan areas, such as Gyeongbuk and Chungbuk, to mitigate risks of stroke and CA [
29] (
Fig. 3C). During summer, inland regions such as Gangwon may benefit from region-specific surveillance systems and risk assessment models that incorporate meteorological factors, which could explain sustained vulnerability despite improved average air quality [
30] (
Fig. 3B).
Our findings are consistent with previous research documenting stronger PM–stroke associations under extreme winter conditions in Seoul [
31] and springtime soil-dust peaks in Incheon, as well as autumn industrial/coal impacts in Daegu [
32]. These studies document seasonal and spatial heterogeneity in pollution–health relationships. However, prior research has generally focused on single pollutants or individual cities, whereas our GAE-based network analysis integrates multi-pollutant, multi-region time-series data to reveal how and when pollutant–disease clusters form across Korea [
33]. This network approach uncovers interconnected risk modules—such as winter NO
2/O
3–stroke and spring PM–MI clusters—and tracks their spatiotemporal evolution, offering dynamic insights and identifying periods and subregional vulnerabilities that traditional models may not capture [
34]. Notably, our network-level findings recent policy evaluations in Seoul showing that long-term air quality improvements correspond with reductions in cardiovascular morbidity, reinforcing the real-world value of targeted interventions [
35].
Several limitations should be acknowledged. First, the analysis was restricted to a 2-year period, which may not capture longer-term trends or lagged effects of pollution exposure. Second, health data were limited to emergency room visits, which may underestimate the overall disease burden. Third, the study used only monthly aggregated NEDIS emergency room visit data, which precluded direct assessment of daily or weekly acute exposure–effect relationships. Although monthly aggregation reduces noise and computational burden, it may mask short-lag effects. Fourth, the analysis was conducted at the provincial (si-do) level (17 regions), potentially missing intra-regional heterogeneity (e.g., variation in pollution and emergency room visit patterns within Seoul). Fifth, although the GAE model captured key pollutant–disease associations, it did not adjust for meteorological variables (such as temperature or humidity), individual-level risk factors, or socioeconomic status, all of which could confound or modify the observed associations. The exclusion of these covariates may have led to attenuation or inflation of some edge strengths, depending on region and season.
Generalizability
Despite these constraints, the study’s national scope and use of standardized administrative data enhance its generalizability within Korea. The methodological framework—particularly the GAE modeling—can be adapted to other countries with similar air pollution and health data systems. The visual and analytical insights derived from this model are valuable for healthcare policymakers, urban planners, and environmental health professionals aiming to develop locally tailored public health interventions.
Suggestions for further studies
Future studies should expand the observation period and include a broader array of health outcomes, such as hospitalizations and mortality. Incorporating meteorological, behavioral, and socioeconomic data would improve model precision and policy relevance. Further, investigating lagged effects of pollutant exposure and applying explainable AI methods to graph models may offer deeper insight into causal mechanisms. Ultimately, the integration of network science and public health surveillance offers a powerful approach for disease prevention and environmental risk management in increasingly urbanized societies.
High-resolution si/gun/gu-level graph analyses (corresponding to cities, counties, and districts), integrating inter-district movement matrices with moving-average pollutant exposure metrics, could trace subregional pollution–disease diffusion in a time-series framework, supporting improved causal inference and more targeted interventions.
Conclusion
This study investigated the spatiotemporal dynamics of emergency room visits associated with air pollution exposure in Korea by applying a GAE model to national datasets from 2022 to 2023. The analysis identified distinct seasonal and regional patterns in the associations between 6 major air pollutants and 4 categories of cardiovascular and cerebrovascular diseases.
We found that the strength and structure of pollutant–disease relationships varied significantly by season and urbanization level. Notably, NO2 and O3 played dominant roles in disease associations during winter and autumn, while particulate matter (PM10 and PM2.5) showed strong links to cardiac events in spring. In contrast, summer was characterized by overall weaker associations, though inland areas such as Gangwon continued to exhibit localized vulnerability. Urban regions consistently exhibited denser and more complex pollutant–disease networks compared to non-urban areas. These findings support the initial research aim of revealing the complex, multivariate relationships between environmental exposures and acute health outcomes across time and space. The use of GAE modeling enabled us to capture and visualize these nonlinear associations more effectively than conventional statistical methods.
From a medical and public health perspective, this study highlights the importance of season-specific and region-specific strategies for air pollution management and disease prevention. By pinpointing when and where pollutant–disease associations are most pronounced, our results can inform targeted interventions, risk communication, and policy planning to reduce preventable emergency health events and improve cardiovascular and cerebrovascular health nationwide.
-
Authors’ contribution
Conceptualization: EH. Data curation: SJ. Methodology/formal analysis/validation: SW, SJ. Project administration: EH. Funding acquisition: none. Writing–original draft: SW. Writing–review & editing: SW, SJ, EH.
-
Conflict of interest
No potential conflict of interest relevant to this article was reported.
-
Funding
None.
-
Data availability
The datasets analyzed in this study are publicly available from the following sources:
Dataset 1. Hourly air pollution measurement data (SO2, NO2, O3, CO, PM10, PM2.5) from 17 administrative regions in Korea (2022–2023) can be accessed via the AirKorea Final Confirmation Measurement Data Portal: (https://www.airkorea.or.kr/web/pastSearch?pMENU_NO=123).
Dataset 2. Emergency room visit records related to cardiovascular and cerebrovascular diseases (2022–2023) are available from the NEDIS Emergency Medical Portal Statistical Yearbook: (https://www.e-gen.or.kr/nemc/statistics_annual_report.do?brdclscd=02).
All data used in this study are publicly accessible, and no proprietary or restricted datasets were used. The code used for analysis is available on GitHub: (https://github.com/seungpil720/sohee).
-
Acknowledgments
None.
Supplementary materials
Fig. 1.Overview of data sources, preprocessing, and analysis pipeline. This flowchart illustrates the data integration and preprocessing steps used in the study. Emergency room visit records (n=396,713) for 4 cardiovascular and cerebrovascular conditions—myocardial infarction (MI), hemorrhagic stroke (HS), ischemic stroke (IS), and cardiac arrest (CA)—were obtained from the National Emergency Department Information System (NEDIS) for 2022–2023. After excluding records with missing regional information (n=5,693), 391,020 cases were included in the final analysis. Simultaneously, hourly air pollutant data (n=378,951) from AirKorea were aggregated into monthly averages for 6 pollutants (SO2, NO2, O3, CO, PM10, and PM2.5) across 17 regions. All variables were normalized using Min-Max scaling. The datasets were merged by region and month, resulting in 12 seasonal and 17 regional datasets. Correlation matrices were computed for each dataset to construct adjacency matrices, which were used as input for graph autoencoder modeling.

Fig. 2.Visualization of pollutant–disease networks by season and region (2022). This figure presents representative graph autoencoder (GAE) network outputs, showing seasonal (A–D) and regional (E–H) variations in the relationships between air pollutants and emergency room visit diseases in Korea during 2022. Circular nodes represent air pollutants (SO2, NO2, O3, CO, PM10, and PM2.5), while square nodes represent disease categories: cardiac arrest (CA), myocardial infarction (MI), ischemic stroke (IS), and hemorrhagic stroke (HS). Edges indicate learned associations, with thicker lines representing stronger predicted relationships. Red numbers denote the average predicted edge strength (mean ≥0.5) for each network. Panels (A–D) show seasonal networks for January, April, August, and October 2022, respectively. Panels (E–H) display regional networks for Busan, Seoul, Chungbuk, and Gangwon in 2022. The visualizations highlight pronounced seasonal changes in network density and structure: winter (A) and spring (B) show high connectivity, while summer (C) is much sparser. Regional differences are also clear: urban areas like Busan (E) and Seoul (F) display more complex networks, whereas Chungbuk (G) and Gangwon (H) have less integrated structures.

Fig. 3.Spatiotemporal hotspots of strong pollutant–disease associations by season. This figure highlights region- and season-specific pollutant–disease pairs with relatively strong associations based on graph autoencoder predictions. Each panel presents a map of South Korea with red-shaded areas indicating regions with significantly elevated edge strengths. Accompanying tables summarize the mean edge values across all seasons, within the highlighted season, and for specific regions, along with their relative significance. (A) Spring: PM10 is strongly associated with myocardial infarction (MI) in Ulsan and with cardiac arrest (CA) in Seoul and Daejeon. These associations are most prominent in spring, showing more than 3-fold increases in relative significance in the hotspot regions. (B) Summer: Gangwon is identified as a hotspot for PM2.5–ischemic stroke (IS) associations, with a relative increase in edge strength during summer. (C) Autumn: NO2 exhibits a strong seasonal link with cardiac arrest in Gyeongbuk, indicating increased vulnerability in this region during autumn. (D) Winter: NO2–IS and O3–IS associations are especially elevated in Daegu and Busan, respectively, with winter showing the highest relative significance for these edges (up to 2.11-fold).

References
- 1. Lee HH, Cho SM, Lee H, Baek J, Bae JH, Chung WJ, Kim HC. Korea heart disease fact sheet 2020: analysis of nationwide data. Korean Circ J 2021;51:495-503. https://doi.org/10.4070/kcj.2021.0097
- 2. de Bont J, Jaganathan S, Dahlquist M, Persson A, Stafoggia M, Ljungman P. Ambient air pollution and cardiovascular diseases: an umbrella review of systematic reviews and meta-analyses. J Intern Med 2022;291:779-800. https://doi.org/10.1111/joim.13467
- 3. Toubasi A, Al-Sayegh TN. Short-term exposure to air pollution and ischemic stroke: a systematic review and meta-analysis. Neurology 2023;101:e1922-e1932. https://doi.org/10.1212/WNL.0000000000207856
- 4. Zou L, Zong Q, Fu W, Zhang Z, Xu H, Yan S, Mao J, Zhang Y, Cao S, Lv C. Long-term exposure to ambient air pollution and myocardial infarction: a systematic review and meta-analysis. Front Med (Lausanne) 2021;8:616355. https://doi.org/10.3389/fmed.2021.616355
- 5. Pan C, Xu C, Zheng J, Song R, Lv C, Zhang G, Tan H, Ma Y, Zhu Y, Han X, Li C, Yan S, Zheng W, Wang C, Zhang J, Bian Y, Ma J, Cheng K, Liu R, Hou Y, Chen Q, Zhao X, McNally B, Chen R, Kan H, Meng X, Chen Y, Xu F. Fine and coarse particulate air pollution and out-of-hospital cardiac arrest onset: a nationwide case-crossover study in China. J Hazard Mater 2023;457:131829. https://doi.org/10.1016/j.jhazmat.2023.131829
- 6. Kim H, Kim J, Kim S, Kang SH, Kim HJ, Kim H, Heo J, Yi SM, Kim K, Youn TJ, Chae IH. Cardiovascular effects of long-term exposure to air pollution: a population-based study with 900 845 person-years of follow-up. J Am Heart Assoc 2017;6:e007170. https://doi.org/10.1161/JAHA.117.007170
- 7. Cesaroni G, Forastiere F, Stafoggia M, Andersen ZJ, Badaloni C, Beelen R, Caracciolo B, de Faire U, Erbel R, Eriksen KT, Fratiglioni L, Galassi C, Hampel R, Heier M, Hennig F, Hilding A, Hoffmann B, Houthuijs D, Jöckel KH, Korek M, Lanki T, Leander K, Magnusson PK, Migliore E, Ostenson CG, Overvad K, Pedersen NL, J JP, Penell J, Pershagen G, Pyko A, Raaschou-Nielsen O, Ranzi A, Ricceri F, Sacerdote C, Salomaa V, Swart W, Turunen AW, Vineis P, Weinmayr G, Wolf K, de Hoogh K, Hoek G, Brunekreef B, Peters A. Long term exposure to ambient air pollution and incidence of acute coronary events: prospective cohort study and meta-analysis in 11 European cohorts from the ESCAPE Project. BMJ 2014;348:f7412. https://doi.org/10.1136/bmj.f7412
- 8. Mustafic H, Jabre P, Caussin C, Murad MH, Escolano S, Tafflet M, Perier MC, Marijon E, Vernerey D, Empana JP, Jouven X. Main air pollutants and myocardial infarction: a systematic review and meta-analysis. JAMA 2012;307:713-721. https://doi.org/10.1001/jama.2012.126
- 9. Billionnet C, Sherrill D, Annesi-Maesano I. Estimating the health effects of exposure to multi-pollutant mixture. Ann Epidemiol 2012;22:126-141. https://doi.org/10.1016/j.annepidem.2011.11.004
- 10. Hooper LG, Kaufman JD. Ambient air pollution and clinical implications for susceptible populations. Ann Am Thorac Soc 2018;15:S64-S68. https://doi.org/10.1513/AnnalsATS.201707-574MG
- 11. Dominski FH, Lorenzetti Branco JH, Buonanno G, Stabile L, Gameiro da Silva M, Andrade A. Effects of air pollution on health: a mapping review of systematic reviews and meta-analyses. Environ Res 2021;201:111487. https://doi.org/10.1016/j.envres.2021.111487
- 12. Bazyar J, Pourvakhshoori N, Khankeh H, Farrokhi M, Delshad V, Rajabi E. A comprehensive evaluation of the association between ambient air pollution and adverse health outcomes of major organ systems: a systematic review with a worldwide approach. Environ Sci Pollut Res Int 2019;26:12648-12661. https://doi.org/10.1007/s11356-019-04874-z
- 13. Kipf TN, Welling M. Variational graph auto-encoders. arXiv [Preprint] 2016 Nov 21. https://doi.org/10.48550/arXiv.1611.07308
- 14. Kim OJ, Kim SY. Regional difference in the association between long-term PM and cardiovascular disease incidence and potential determinants of the difference. Geohealth 2025;9:e2024GH001245. https://doi.org/10.1029/2024GH001245
- 15. Cichowicz R, Wielgosinski G, Fetter W. Dispersion of atmospheric air pollution in summer and winter season. Environ Monit Assess 2017;189:605. https://doi.org/10.1007/s10661-017-6319-2
- 16. Olvera Alvarez HA, Myers OB, Weigel M, Armijos RX. The value of using seasonality and meteorological variables to model intra-urban PM variation. Atmos Environ (1994) 2018;182:1-8. https://doi.org/10.1016/j.atmosenv.2018.03.007
- 17. Kim H, Zhang Q, Bae GN, Kim JY, Lee SB. Sources and atmospheric processing of winter aerosols in Seoul, Korea: insights from real-time measurements using a high-resolution aerosol mass spectrometer. Atmos Chem Phys 2017;17:2009-2033. https://doi.org/10.5194/acp-17-2009-2017
- 18. Park EH, Heo J, Kim H, Yi SM. Long term trends of chemical constituents and source contributions of PM in Seoul. Chemosphere 2020;251:126371. https://doi.org/10.1016/j.chemosphere.2020.126371
- 19. Li Q, Zhang H, Jin X, Cai X, Song Y. Mechanism of haze pollution in summer and its difference with winter in the North China Plain. Sci Total Environ 2022;806:150625. https://doi.org/10.1016/j.scitotenv.2021.150625
- 20. Jung SH, Baek SH, Park SY, Lee CM, Lee JI. Regional differences in PM chemical composition and inhalation risk assessment: a case study of Seoul, Incheon, and Wonju. Toxics 2025;13:240. https://doi.org/10.3390/toxics13040240
- 21. Lee UJ, Kim MJ, Kim EJ, Lee DW, Lee SD. Spatial distribution characteristics and analysis of PM2. 5 in South Korea: a geographically weighted regression analysis. Atmosphere 2024;15:69. https://doi.org/10.3390/atmos15010069
- 22. Bell ML, Ebisu K, Peng RD, Dominici F. Adverse health effects of particulate air pollution: modification by air conditioning. Epidemiology 2009;20:682-686. https://doi.org/10.1097/EDE.0b013e3181aba749
- 23. Wang Q. Urbanization and global health: the role of air pollution. Iran J Public Health 2018;47:1644-1652.
- 24. Samet JM, White RH. Urban air pollution, health, and equity. J Epidemiol Community Health 2004;58:3-5. https://doi.org/10.1136/jech.58.1.3
- 25. Liu M, Zhang Z, Dunson DB. Graph auto-encoding brain networks with applications to analyzing large-scale brain imaging datasets. Neuroimage 2021;245:118750. https://doi.org/10.1016/j.neuroimage.2021.118750
- 26. Colombi NK, Jacob DJ, Yang LH, Zhai S, Shah V, Grange SK, Yantosca RM, Kim S, Liao H. Why is ozone in South Korea and the Seoul metropolitan area so high and increasing? Atmos Chem Phys 2023;23:4031-4044. https://doi.org/10.5194/acp-23-4031-2023
- 27. Bae HJ, Shin YS, Park JG, Pak H. Interactive effects between ozone and temperature on respiratory admissions in Korea. ISEE Conf Abstr 2013;2013:5102. https://doi.org/10.1289/isee.2013.P-1-12-19
- 28. Kang SH, Heo J, Oh IY, Kim J, Lim WH, Cho Y, Choi EK, Yi SM, Do Shin S, Kim H, Oh S. Ambient air pollution and out-of-hospital cardiac arrest. Int J Cardiol 2016;203:1086-1092. https://doi.org/10.1016/j.ijcard.2015.11.100
- 29. Song J, Lim Y, Ko I, Kim JY, Kim DK. Association between air pollutants and initial hospital admission for ischemic stroke in Korea from 2002 to 2013. J Stroke Cerebrovasc Dis 2021;30:106080. https://doi.org/10.1016/j.jstrokecerebrovasdis.2021.106080
- 30. Yeo MJ, Kim YP. Long-term trends and affecting factors in the concentrations of criteria air pollutants in South Korea. J Environ Manage 2022;317:115458. https://doi.org/10.1016/j.jenvman.2022.115458
- 31. Park SK. Seasonal variations of fine particulate matter and mortality rate in Seoul, Korea with a focus on the short-term impact of meteorological extremes on human health. Atmosphere 2021;12:151. https://doi.org/10.3390/atmos12020151
- 32. Choi E, Yi SM, Lee YS, Jo H, Baek SO, Heo JB. Sources of airborne particulate matter-bound metals and spatial-seasonal variability of health risk potentials in four large cities, South Korea. Environ Sci Pollut Res Int 2022;29:28359-28374. https://doi.org/10.1007/s11356-021-18445-8
- 33. Testa A, Biondi-Zoccai G, Anticoli S, Pezzella FR, Mangiardi M, DI Giosa A, Marchegiani G, Frati G, Sciarretta S, Perrotta A, Peruzzi M, Cavarretta E, Gaspardone A, Mariano E, Federici M, Montone RA, Dei Giudici A, Versaci B, Versaci F. Cluster analysis of weather and pollution features and its role in predicting acute cardiac or cerebrovascular events. Minerva Med 2022;113:825-832. https://doi.org/10.23736/S0026-4806.22.08036-3
- 34. Dias D, Tchepel O. Spatial and temporal dynamics in air pollution exposure assessment. Int J Environ Res Public Health 2018;15:558. https://doi.org/10.3390/ijerph15030558
- 35. Han C, Lim YH, Yorifuji T, Hong YC. Air quality management policy and reduced mortality rates in Seoul Metropolitan Area: a quasi-experimental study. Environ Int 2018;121:600-609. https://doi.org/10.1016/j.envint.2018.09.047